Filtering and plotting
Kirill Müller, cynkra GmbH
Nov 28, 2017
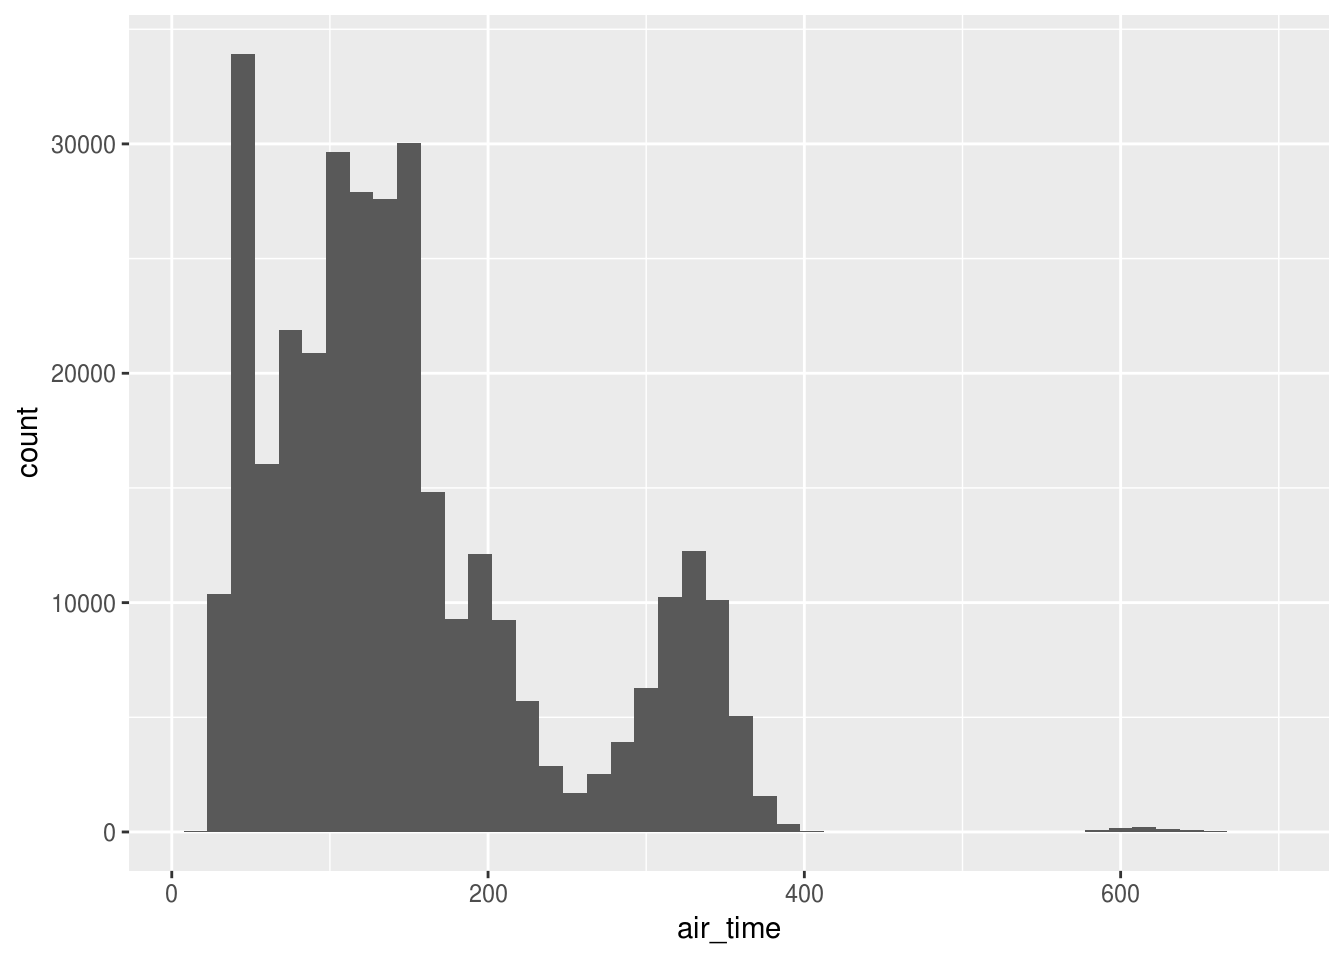
Histogram of air time of all flights
flights %>%
  ggplot() +
  geom_histogram(
    aes(x = air_time),
    na.rm = TRUE,
    binwidth = 15
  )
flights %>%
  filter(dest != "HNL") %>%
  ggplot() +
  geom_histogram(
    aes(x = air_time),
    na.rm = TRUE,
    binwidth = 15
  )
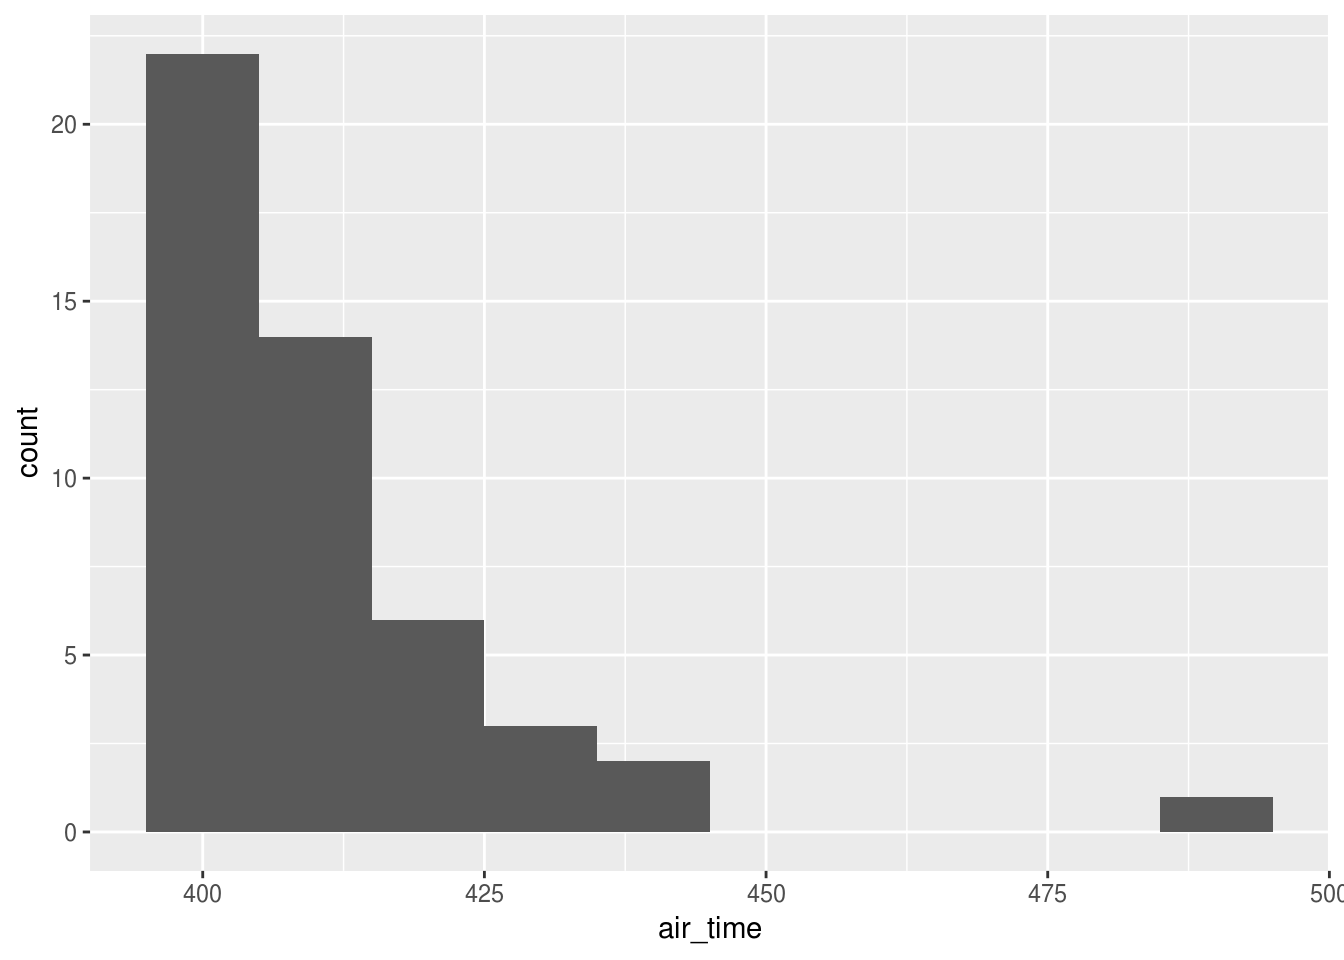
flights %>%
  filter(dest != "HNL") %>%
  filter(between(air_time, 400, 500)) %>%
  ggplot() +
  geom_histogram(
    aes(x = air_time),
    na.rm = TRUE,
    binwidth = 10
  )
All very close relations
flights %>%
  filter(air_time < 60) %>%
  ggplot() +
  geom_bin2d(aes(origin, dest))
Copyright © 2018 Kirill Müller. Licensed under CC BY-NC 4.0.