class: center, middle, inverse, title-slide # Data visualisation, reporting, and processing with R ## Introduction ### Kirill Müller, cynkra GmbH ### 2018-11-29 --- background-image: url(images/datasaurus-dozen.gif) class: center # The Datasaurus Dozen (2017) .footnote[ **Source**: Justin Matejka, George Fitzmaurice: Same Stats, Different Graphs: Generating Datasets with Varied Appearance and Identical Statistics through Simulated Annealing, ACM SIGCHI Conference on Human Factors in Computing Systems ] --- class: center # Anscombe's Quartet (1973) 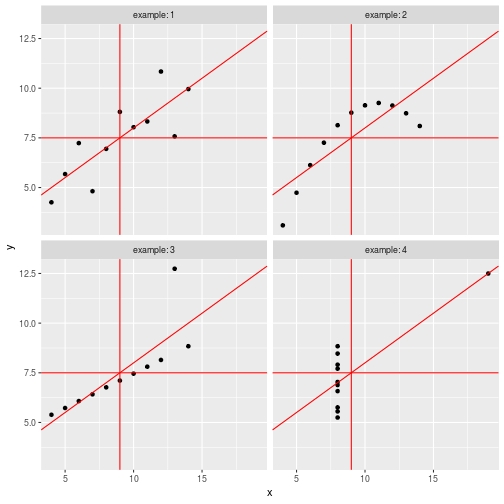<!-- --> --- class: center # Anscombe's Quartet (1973) <div id="htmlwidget-bc5e2c18fc32d8ff6d3d" style="width:100%;height:auto;" class="datatables html-widget"></div> <script type="application/json" data-for="htmlwidget-bc5e2c18fc32d8ff6d3d">{"x":{"filter":"none","data":[["1","2","3","4","5","6","7","8","9","10","11"],[10,8,13,9,11,14,6,4,12,7,5],[10,8,13,9,11,14,6,4,12,7,5],[10,8,13,9,11,14,6,4,12,7,5],[8,8,8,8,8,8,8,19,8,8,8],[8.04,6.95,7.58,8.81,8.33,9.96,7.24,4.26,10.84,4.82,5.68],[9.14,8.14,8.74,8.77,9.26,8.1,6.13,3.1,9.13,7.26,4.74],[7.46,6.77,12.74,7.11,7.81,8.84,6.08,5.39,8.15,6.42,5.73],[6.58,5.76,7.71,8.84,8.47,7.04,5.25,12.5,5.56,7.91,6.89]],"container":"<table class=\"display\">\n <thead>\n <tr>\n <th> <\/th>\n <th>x1<\/th>\n <th>x2<\/th>\n <th>x3<\/th>\n <th>x4<\/th>\n <th>y1<\/th>\n <th>y2<\/th>\n <th>y3<\/th>\n <th>y4<\/th>\n <\/tr>\n <\/thead>\n<\/table>","options":{"paging":false,"searching":false,"info":false,"columnDefs":[{"className":"dt-right","targets":[1,2,3,4,5,6,7,8]},{"orderable":false,"targets":0}],"order":[],"autoWidth":false,"orderClasses":false}},"evals":[],"jsHooks":[]}</script> ??? Discuss with neighbors: What would you (need to) do in your favorite software (Excel, SPSS, SAS, ...) to 1. generate these four plots from this dataset? 2. verify that the summary statistics are identical for the four underlying datasets? --- # Tidy data > “Tidy datasets are all alike, but every messy dataset is messy in its own way.” –– Hadley Wickham ## Definition 1. Each variable must have its own column. 2. Each observation must have its own row. 3. Each value must have its own cell.  Source: Grolemund and Wickham, R for data science ??? Source: R4DS --- ```r anscombe ``` ``` ## x1 x2 x3 x4 y1 y2 y3 y4 ## 1 10 10 10 8 8.04 9.14 7.46 6.58 ## 2 8 8 8 8 6.95 8.14 6.77 5.76 ## 3 13 13 13 8 7.58 8.74 12.74 7.71 ## 4 9 9 9 8 8.81 8.77 7.11 8.84 ## 5 11 11 11 8 8.33 9.26 7.81 8.47 ## 6 14 14 14 8 9.96 8.10 8.84 7.04 ## 7 6 6 6 8 7.24 6.13 6.08 5.25 ## 8 4 4 4 19 4.26 3.10 5.39 12.50 ## 9 12 12 12 8 10.84 9.13 8.15 5.56 ## 10 7 7 7 8 4.82 7.26 6.42 7.91 ## 11 5 5 5 8 5.68 4.74 5.73 6.89 ``` --- ```r anscombe %>% as_tibble() ``` ``` ## # A tibble: 11 x 8 ## x1 x2 x3 x4 y1 y2 y3 y4 ## <dbl> <dbl> <dbl> <dbl> <dbl> <dbl> <dbl> <dbl> ## 1 10 10 10 8 8.04 9.14 7.46 6.58 ## 2 8 8 8 8 6.95 8.14 6.77 5.76 ## 3 13 13 13 8 7.58 8.74 12.7 7.71 ## 4 9 9 9 8 8.81 8.77 7.11 8.84 ## 5 11 11 11 8 8.33 9.26 7.81 8.47 ## 6 14 14 14 8 9.96 8.1 8.84 7.04 ## 7 6 6 6 8 7.24 6.13 6.08 5.25 ## 8 4 4 4 19 4.26 3.1 5.39 12.5 ## 9 12 12 12 8 10.8 9.13 8.15 5.56 ## 10 7 7 7 8 4.82 7.26 6.42 7.91 ## 11 5 5 5 8 5.68 4.74 5.73 6.89 ``` --- ```r anscombe %>% as_tibble() %>% rowid_to_column("obs") ``` ``` ## # A tibble: 11 x 9 ## obs x1 x2 x3 x4 y1 y2 y3 y4 ## <int> <dbl> <dbl> <dbl> <dbl> <dbl> <dbl> <dbl> <dbl> ## 1 1 10 10 10 8 8.04 9.14 7.46 6.58 ## 2 2 8 8 8 8 6.95 8.14 6.77 5.76 ## 3 3 13 13 13 8 7.58 8.74 12.7 7.71 ## 4 4 9 9 9 8 8.81 8.77 7.11 8.84 ## 5 5 11 11 11 8 8.33 9.26 7.81 8.47 ## 6 6 14 14 14 8 9.96 8.1 8.84 7.04 ## 7 7 6 6 6 8 7.24 6.13 6.08 5.25 ## 8 8 4 4 4 19 4.26 3.1 5.39 12.5 ## 9 9 12 12 12 8 10.8 9.13 8.15 5.56 ## 10 10 7 7 7 8 4.82 7.26 6.42 7.91 ## 11 11 5 5 5 8 5.68 4.74 5.73 6.89 ``` --- ```r anscombe %>% as_tibble() %>% rowid_to_column("obs") %>% gather(key, value, -obs) ``` ``` ## # A tibble: 88 x 3 ## obs key value ## <int> <chr> <dbl> ## 1 1 x1 10 ## 2 2 x1 8 ## 3 3 x1 13 ## 4 4 x1 9 ## 5 5 x1 11 ## 6 6 x1 14 ## 7 7 x1 6 ## 8 8 x1 4 ## 9 9 x1 12 ## 10 10 x1 7 ## # ... with 78 more rows ``` --- ```r anscombe %>% as_tibble() %>% rowid_to_column("obs") %>% gather(key, value, -obs) %>% separate(key, into = c("axis", "example"), sep = 1) ``` ``` ## # A tibble: 88 x 4 ## obs axis example value ## <int> <chr> <chr> <dbl> ## 1 1 x 1 10 ## 2 2 x 1 8 ## 3 3 x 1 13 ## 4 4 x 1 9 ## 5 5 x 1 11 ## 6 6 x 1 14 ## 7 7 x 1 6 ## 8 8 x 1 4 ## 9 9 x 1 12 ## 10 10 x 1 7 ## # ... with 78 more rows ``` --- ```r anscombe %>% as_tibble() %>% rowid_to_column("obs") %>% gather(key, value, -obs) %>% separate(key, into = c("axis", "example"), sep = 1) %>% spread(axis, value) ``` ``` ## # A tibble: 44 x 4 ## obs example x y ## <int> <chr> <dbl> <dbl> ## 1 1 1 10 8.04 ## 2 1 2 10 9.14 ## 3 1 3 10 7.46 ## 4 1 4 8 6.58 ## 5 2 1 8 6.95 ## 6 2 2 8 8.14 ## 7 2 3 8 6.77 ## 8 2 4 8 5.76 ## 9 3 1 13 7.58 ## 10 3 2 13 8.74 ## # ... with 34 more rows ``` --- ```r tidy_anscombe <- anscombe %>% as_tibble() %>% rowid_to_column("obs") %>% gather(key, value, -obs) %>% separate(key, into = c("axis", "example"), sep = 1) %>% spread(axis, value) tidy_anscombe ``` ``` ## # A tibble: 44 x 4 ## obs example x y ## <int> <chr> <dbl> <dbl> ## 1 1 1 10 8.04 ## 2 1 2 10 9.14 ## 3 1 3 10 7.46 ## 4 1 4 8 6.58 ## 5 2 1 8 6.95 ## 6 2 2 8 8.14 ## 7 2 3 8 6.77 ## 8 2 4 8 5.76 ## 9 3 1 13 7.58 ## 10 3 2 13 8.74 ## # ... with 34 more rows ``` --- ```r tidy_anscombe %>% group_by(example) %>% summarise( mean(x), mean(y), var(x), var(y), cor(x, y) ) %>% ungroup() ``` ``` ## # A tibble: 4 x 6 ## example `mean(x)` `mean(y)` `var(x)` `var(y)` `cor(x, y)` ## <chr> <dbl> <dbl> <dbl> <dbl> <dbl> ## 1 1 9 7.50 11 4.13 0.816 ## 2 2 9 7.50 11 4.13 0.816 ## 3 3 9 7.5 11 4.12 0.816 ## 4 4 9 7.50 11 4.12 0.817 ``` --- ```r tidy_anscombe_sum <- tidy_anscombe %>% group_by(example) %>% summarise( mean(x), mean(y), var(x), var(y), cor(x, y) ) %>% ungroup() tidy_anscombe_sum ``` ``` ## # A tibble: 4 x 6 ## example `mean(x)` `mean(y)` `var(x)` `var(y)` `cor(x, y)` ## <chr> <dbl> <dbl> <dbl> <dbl> <dbl> ## 1 1 9 7.50 11 4.13 0.816 ## 2 2 9 7.50 11 4.13 0.816 ## 3 3 9 7.5 11 4.12 0.816 ## 4 4 9 7.50 11 4.12 0.817 ``` --- ```r ggplot(data = tidy_anscombe) + geom_point(mapping = aes(x = x, y = y)) + facet_wrap(~example, labeller = "label_both") ``` 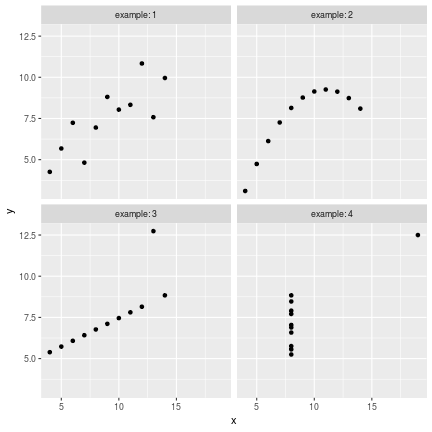<!-- --> ??? No loop, no iteration --- ```r ggplot(data = tidy_anscombe) + geom_point(mapping = aes(x = x, y = y)) + geom_hline( mapping = aes(yintercept = `mean(y)`), data = tidy_anscombe_sum, color = "red" ) + facet_wrap(~example, labeller = "label_both") ``` 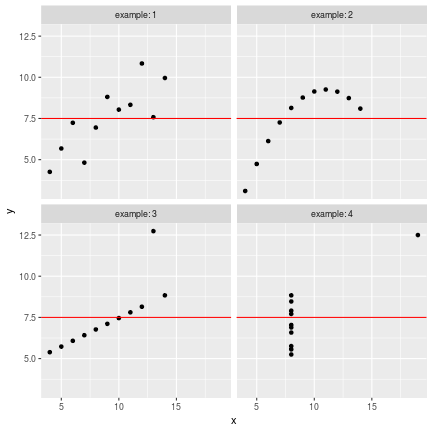<!-- --> --- ```r ggplot(data = tidy_anscombe) + geom_point(mapping = aes(x = x, y = y)) + stat_smooth(mapping = aes(x = x, y = y), method = "lm") + facet_wrap(~example, labeller = "label_both") ``` 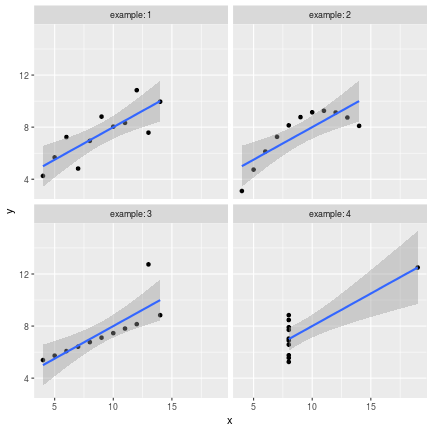<!-- --> --- Source code for the previous slide: ````` ```{r fig.height = 6, fig.width = 6} ggplot(data = tidy_anscombe) + geom_point(mapping = aes(x = x, y = y)) + stat_smooth(mapping = aes(x = x, y = y), method = "lm") + facet_wrap(~example, labeller = "label_both") ``` ````` --- Source code for same slide for showing results only: ````` ```{r fig.height = 6, fig.width = 6, echo = FALSE} ggplot(data = tidy_anscombe) + geom_point(mapping = aes(x = x, y = y)) + stat_smooth(mapping = aes(x = x, y = y), method = "lm") + facet_wrap(~example, labeller = "label_both") ``` ````` --- 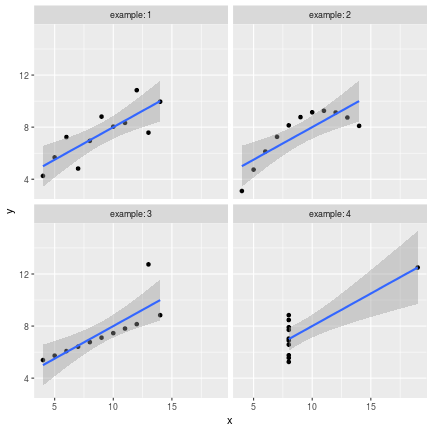<!-- --> --- class: inverse