Window functions
Kirill Müller, cynkra GmbH
Busiest month
Which month is busiest in terms of miles flown, per carrier?
Hint: Compute the share of yearly miles flown of each airline in each month.
monthly_shares <-
  flights %>%
  group_by(___, ___) %>%
  summarize(total_distance_by_carrier = sum(distance)) %>%
  mutate(total_distance = sum(___)) %>%
  ungroup() %>%
  mutate(month_share_by_carrier = ___ / ___)

monthly_shares %>%
  arrange(month_share_by_carrier) %>%
  group_by(___) %>%
  slice(1) %>%
  ungroup()
► Solution:
monthly_shares <-
  flights %>%
  group_by(carrier, month) %>%
  summarize(total_distance_by_carrier = sum(distance)) %>%
  mutate(total_distance = sum(total_distance_by_carrier)) %>%
  ungroup() %>%
  mutate(month_share_by_carrier = total_distance_by_carrier / total_distance)

monthly_shares %>%
  arrange(month_share_by_carrier) %>%
  group_by(carrier) %>%
  slice(1) %>%
  ungroup()
## # A tibble: 16 x 5
## carrier month total_distance_by_car… total_distance month_share_by_carr…
## <chr> <int> <dbl> <dbl> <dbl>
## 1 9E 2 682656 9788152 0.0697
## 2 AA 2 3398633 43864584 0.0775
## 3 AS 11 124904 1715028 0.0728
## 4 B6 2 4336422 58384137 0.0743
## 5 DL 2 4225774 59507317 0.0710
## 6 EV 2 2009426 30498951 0.0659
## 7 F9 2 79380 1109700 0.0715
## 8 FL 11 133849 2167344 0.0618
## 9 HA 10 104643 1704186 0.0614
## 10 MQ 2 1154956 15033955 0.0768
## 11 OO 1 733 16026 0.0457
## 12 UA 2 6239683 89705524 0.0696
## 13 US 2 818288 11365778 0.0720
## 14 VX 2 675525 12902327 0.0524
## 15 WN 2 865202 12229203 0.0707
## 16 YV 3 4122 225395 0.0183Heat map of miles flown
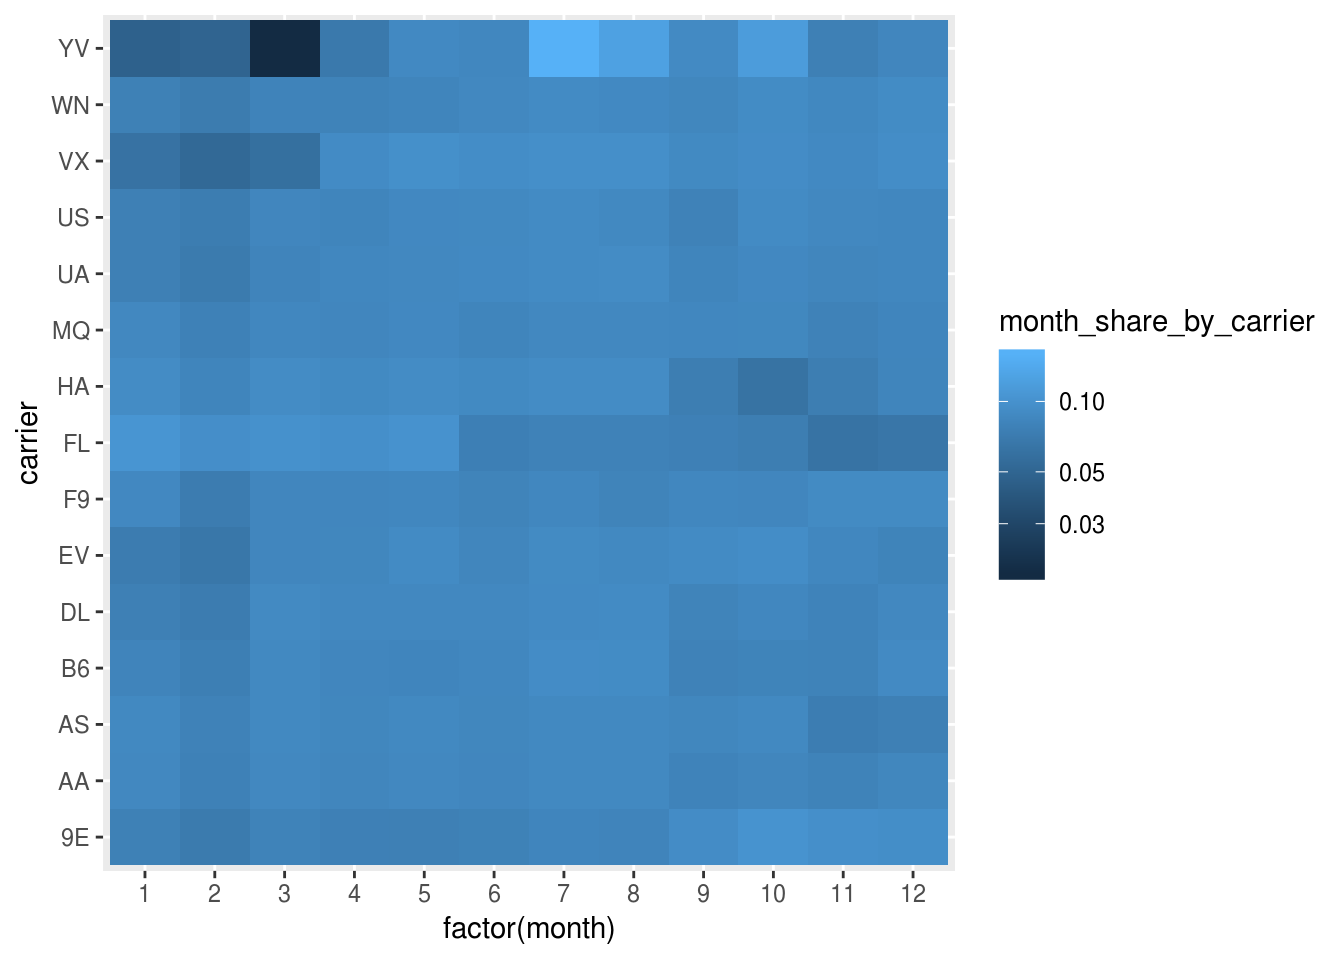
Draw a heat map of miles flown per month per airline to see if this pattern holds across all airlines.
monthly_shares <-
  _____

monthly_shares %>%
  ggplot(aes(factor(month), ___, fill = ___)) +
  geom_tile() +
  scale_fill_continuous(trans = "log10")
► Solution:
monthly_shares %>%
  filter(carrier != "OO") %>%
  ggplot(aes(factor(month), carrier, fill = month_share_by_carrier)) +
  geom_tile() +
  scale_fill_continuous(trans = "log10")
Busiest month
Which month is busiest in terms of miles flown, over all carriers?
flights %>%
  group_by(___) %>%
  mutate(total_distance = sum(___)) %>%
  mutate(month_share = ___ / ___) %>%
  arrange(desc(month_share)) %>%
  slice(1)
Busiest month, visualized
Visualize the number of flights in the busiest month with a bar chart.
More exercises
Find more exercises in Section 5.7.1 of r4ds.
Copyright © 2019 Kirill Müller. Licensed under CC BY-NC 4.0.