Joins
Kirill Müller, cynkra GmbH
June 2, 2017
Counting distinct observations
How are the flights, airlines, and airports datasets connected? Which are primary, which are foreign keys?
Hint: Use count() to support your hypothesis.
flights %>%
  count(carrier) %>%
  filter(n > 1)

airlines %>%
  count(___) %>%
  filter(___)

airports %>%
  _____ %>%
  _____
► Solution:
airlines %>%
  count(carrier) %>%
  filter(n > 1)
## # A tibble: 0 x 2
## # ... with 2 variables: carrier <chr>, n <int>airports %>%
count(faa) %>%
filter(n > 1)## # A tibble: 0 x 2
## # ... with 2 variables: faa <chr>, n <int>Destination by airline
Compute a list of all flights shorter than 300 miles. Use explicit names for the carriers and the destinations. How do you turn off the joining messages? Describe the column names in the result.
Hint: Use by = c("dest" = "faa").
flights %>%
  filter(distance < 300) %>%
  count(dest, carrier) %>%
  left_join(airlines) %>%
  left_join(airports, by = c("___" = "___"))
► Solution:
flights %>%
  filter(distance < 300) %>%
  left_join(airlines, by = "carrier") %>%
  left_join(airports, by = c("dest" = "faa"))
## # A tibble: 51,287 x 27
## year month day dep_time sched_dep_time dep_delay arr_time
## <int> <int> <int> <int> <int> <dbl> <int>
## 1 2013 1 1 557 600 -3 709
## 2 2013 1 1 559 559 0 702
## 3 2013 1 1 629 630 -1 721
## 4 2013 1 1 632 608 24 740
## 5 2013 1 1 639 640 -1 739
## 6 2013 1 1 732 735 -3 857
## 7 2013 1 1 733 736 -3 854
## 8 2013 1 1 801 805 -4 900
## 9 2013 1 1 803 810 -7 903
## 10 2013 1 1 820 830 -10 940
## # ... with 51,277 more rows, and 20 more variables: sched_arr_time <int>,
## # arr_delay <dbl>, carrier <chr>, flight <int>, tailnum <chr>,
## # origin <chr>, dest <chr>, air_time <dbl>, distance <dbl>, hour <dbl>,
## # minute <dbl>, time_hour <dttm>, name.x <chr>, name.y <chr>, lat <dbl>,
## # lon <dbl>, alt <int>, tz <dbl>, dst <chr>, tzone <chr>Destination by airline, wide form
Count the number of observations per airline per destination, and convert to wide form using nice labels for better use of screen space. Do you use spread() or gather()? How do you replace the NA values with zeros?
# The name of the `name` variable isn't very useful,
# need to rename it
flights %>%
  filter(distance < 300) %>%
  count(dest, carrier) %>%
  left_join(_____) %>%
  rename(carrier_name = ___) %>%
  left_join(_____) %>%
  rename(_____) %>%
  count(_____) %>%
  _____(_____)
► Solution:
flights %>%
  filter(distance < 300) %>%
  left_join(airlines, by = "carrier") %>%
  rename(carrier_name = name) %>%
  left_join(airports, by = c("dest" = "faa")) %>%
  rename(airport_name = name) %>%
  count(carrier_name, airport_name) %>%
  spread(carrier_name, n)
## # A tibble: 19 x 12
## airport_name `American Airli… `Delta Air Line… `Endeavor Air I…
## <chr> <int> <int> <int>
## 1 Albany Intl NA NA NA
## 2 Baltimore W… NA NA 856
## 3 Bradley Intl NA NA NA
## 4 Buffalo Nia… NA 3 54
## 5 Burlington … NA NA 2
## 6 General Edw… 1455 972 914
## 7 Greater Roc… NA NA 281
## 8 La Guardia NA NA NA
## 9 Manchester … NA NA 11
## 10 "Martha\\\\… NA NA 71
## 11 Nantucket M… NA NA NA
## 12 Norfolk Intl NA NA 402
## 13 Philadelphi… NA 2 940
## 14 Portland In… NA 235 NA
## 15 Richmond In… NA NA 340
## 16 Ronald Reag… NA 2 1074
## 17 Syracuse Ha… NA NA 170
## 18 Theodore Fr… NA NA NA
## 19 Washington … NA NA 664
## # ... with 8 more variables: `Envoy Air` <int>, `ExpressJet Airlines
## # Inc.` <int>, `JetBlue Airways` <int>, `Mesa Airlines Inc.` <int>,
## # `SkyWest Airlines Inc.` <int>, `Southwest Airlines Co.` <int>, `United
## # Air Lines Inc.` <int>, `US Airways Inc.` <int>Destination by airline, economic join
Change the code from the last example to use count() right after filter(). What additional steps do you need?
airline_names <-
  airlines %>%
  _____()

dest_airport_names <-
  _____ %>%
  _____()

flights %>%
  filter(distance < 300) %>%
  count(_____) %>%
  left_join(_____, by = "___") %>%
  select(-___) %>%
  left_join(_____, by = "___") %>%
  _____(_____)
► Solution:
airline_names <-
  airlines %>%
  rename(carrier_name = name)

dest_airport_names <-
  airports %>%
  select(dest = faa, airport_name = name)

verbose_destinations_by_carrier <-
  flights %>%
  filter(distance < 300) %>%
  count(carrier, dest) %>%
  left_join(airline_names, by = "carrier") %>%
  select(-carrier) %>%
  left_join(dest_airport_names, by = "dest") %>%
  select(-dest)

verbose_destinations_by_carrier
## # A tibble: 58 x 3
## n carrier_name airport_name
## <int> <chr> <chr>
## 1 914 Endeavor Air Inc. General Edward Lawrence Logan Intl
## 2 2 Endeavor Air Inc. Burlington Intl
## 3 54 Endeavor Air Inc. Buffalo Niagara Intl
## 4 856 Endeavor Air Inc. Baltimore Washington Intl
## 5 1074 Endeavor Air Inc. Ronald Reagan Washington Natl
## 6 664 Endeavor Air Inc. Washington Dulles Intl
## 7 11 Endeavor Air Inc. Manchester Regional Airport
## 8 71 Endeavor Air Inc. "Martha\\\\'s Vineyard"
## 9 402 Endeavor Air Inc. Norfolk Intl
## 10 940 Endeavor Air Inc. Philadelphia Intl
## # ... with 48 more rowsHeat map
Plot a heat map of destination by airline for all flights shorter than 300 miles, with explicit names. Do you use geom_raster() or geom_bin2d()?
Hint: Use by = c("dest" = "faa").
verbose_destinations_by_carrier <-
  _____

verbose_destinations_by_carrier %>%
  ggplot() +
  geom____(aes(___))
► Solution:
verbose_destinations_by_carrier %>%
  ggplot() +
  geom_raster(aes(airport_name, carrier_name, fill = n)) +
  ggpubr::rotate_x_text()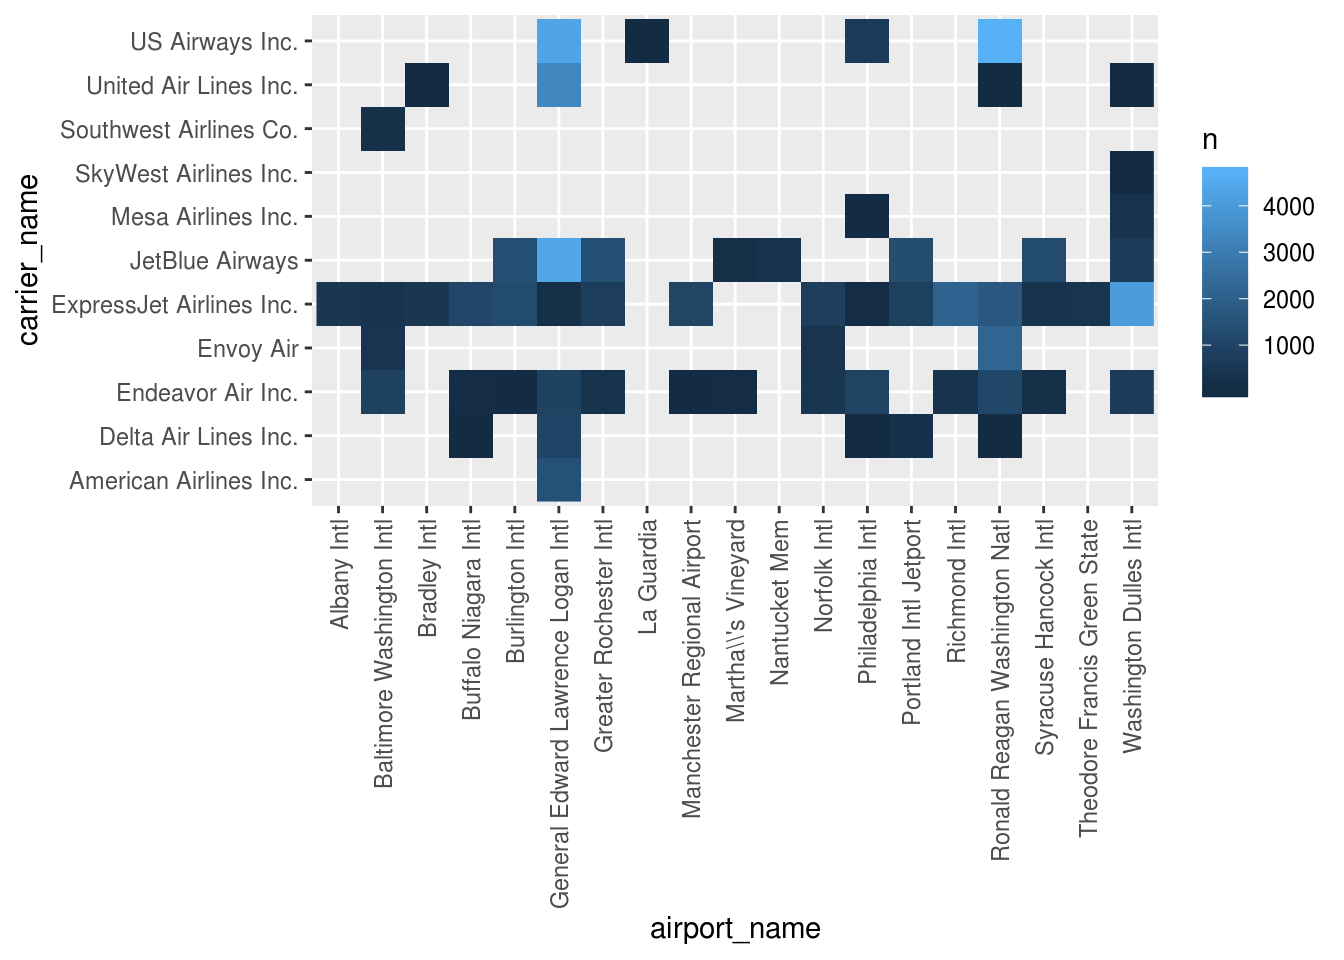
# theme(axis.text.x = element_text(angle = 90, hjust = 1, vjust = 0.5))More exercises
Find more exercises in Section 13.4.6 of r4ds.
Copyright © 2018 Kirill Müller. Licensed under CC BY-NC 4.0.