dplyr exercises part 1
Kirill Müller
Filtering
View the
flightsdataset in RStudio’s data pane. Look up the meaning of the variables in the help.Hint: You need to load the
nycflights13package.View(___)Find all flights that departed between 8:00 AM and 10:00 PM.
flights %>%
  filter(between(dep_time, ___, ___))
Find all flights that departed in the three winter months.
flights %>%
  filter(month ___ c(___)))
Are there any flights where departure time is later than arrival time? What does this mean?
flights %>%
  filter(_____)
Find all flights that departed today four years ago.
flights %>%
  filter(month ___, day ___)
Arrange
On what day did the flight with the shortest airtime take place?
Hint: Use
head()to restrict your result to one row only.flights %>% arrange(___) %>% head(1)Which flights had the heaviest delays? Can you use the
tail()verb to obtain this information?flights %>% arrange(___) %>% tail(1) flights %>% arrange(desc(___)) %>% ___(1)On what day did the flight with the longest airtime take place?
flights %>%
  arrange(___(___)) %>%
  head(1)
Find two equivalent ways to select the six
"UA"flights with the lowest delay. Which is faster? Why?Hint: RStudio has shortcuts for swapping the current line with the next or previous line.
flights %>%
  filter(___) %>%
  arrange(___)

flights %>%
  arrange(___) %>%
  filter(___)
Which flights were best in recovering from delay in the air?
Assignment, the pipe
View all flights that arrived after 10:00 PM. Use an intermediate variable, a nested expression, and the pipe. Which appeals more to you?
flights_after_10 <- filter(flights, ___)
View(flights_after_10)
View(filter(flights, ___))flights %>% filter(___) %>% View()Extend the four solutions to view all
"UA"flights that arrived after 10:00 PM.flights_after_10 <- filter(flights, ___) ua_flights_after_10 <- ... View(___)View(filter(filter(flights, ___)))flights %>% filter(___) %>% filter(___) %>% View()Extend the four solutions to view all
"UA"flights that departed before 6:00 AM and arrived after 10:00 PM.Extend the four solutions to view all
"UA"flights that departed before 6:00 AM and arrived after 10:00 PM and had a delay of more than two hours.Extend the four solutions to view all
"UA"flights that departed before 6:00 AM and arrived after 10:00 PM and had a delay of more than two hours, originating in one of New York City’s airports.Extend the four solutions to view all
"UA"flights that departed before 6:00 AM and arrived after 10:00 PM and had a delay of more than two hours, originating in one of New York City’s airports but excluding Honolulu International airport.Hint: Consult the
airportsdataset, use a filter with the predicatestringr::str_detect(name, "^Honolulu").Sort the result by
distance.
Combining filters
Look at the “Details” section in the help page for
|withhelp("|")to understand predicate logic in R. (We need element-wise comparisons.)Find all flights that departed today x years ago, flown by
"US". Two simple solutions exist, which appeals most to you?flights %>% filter(___, ___) %>% filter(___) flights %>% filter(_____)Find all flights that departed before 6:00 AM or after 10:00 PM.
flights %>%
  filter(___ | ___)
Find all flights not flown by either
"UA"or"WN". Can you think of three different solutions? Which appeals more to you?flights %>% filter(___ ___ ___) flights %>% filter(!(___) ___ !(___)) flights %>% filter(!(_____))Which flights have a missing departure or arrival time? Which have both missing? Can the number of flights that have a missing arrival but not departure time correspond to lost or crashed flights?
flights %>%
  filter(is.na(___))

flights %>%
  filter(___(___) ___ _____)

flights %>%
  filter(_____ ___ !_____)
Find two equivalent ways to select the six
"UA"flights with the lowest delay. Which is faster? Why?Hint: RStudio has shortcuts for swapping the current line with the next or previous line.
flights %>%
  filter(___) %>%
  arrange(___)

flights %>%
  arrange(___) %>%
  filter(___)
Find more exercises in items 1 and 4 of Section 5.2.4, and in Section 5.3.1, of r4ds.
Select and rename
Find three ways to select the first five variables from the
flightsdataset.flights %>% select(___, ___, ________) flights %>% select(___:___) flights %>% select(___:___)Find three ways to exclude the date of the flight.
flights %>%
  select(___, ___, ______________________)

flights %>%
  select(-___, -___, -___)

flights %>%
  select(-___:-___)
Select all variables related to departure.
flights %>%
  select(___, ___, _______)

flights %>%
  select(starts_with("___"))
Move the variables related to scheduled time to the end of the table.
flights %>%
  select(-___, -___, _______, everything(), ___, ___)
Find more exercises in Section 5.4.1 of r4ds.
Mutate
Store the speed for each flight as miles per hour in a new variable.
flights %>%
  mutate(miles_per_hour = air_time ___ distance ___ ___)
Can you use an intermediate variable to clarify the intent? How do you remove the intermediate variable?
flights %>%
  mutate(miles_per_minute = _____) %>%
  mutate(miles_per_hour = _____) %>%
  select(_____)
Create a new logical variable that indicates if the flight arrived on time. Convert it to a useful text, e.g. for later plotting.
flights %>%
  mutate(
    on_time = (___ <= 0),
    on_time_desc = if_else(___, "On time", ___)
  )
Create two new variables
date_houranddate_ymd, usingas.Date()orlubridate::make_date(), respectively. Are the two values the same for all observations? What happens if we omit thetzargument toas.Date()?flights %>% mutate( ___ = as.Date(___, tz = "EST"), ___ = lubridate::make_date(_____) ) %>% filter(___)Find more exercises in Section 5.5.2 of r4ds.
Summarize
Compute the mean arrival and departure delay overall, and per origin airport. What is the standard deviation of these variables? What is New York City’s busiest airport?
flights %>%
  summarize(mean(___, na.rm = ___))

flights %>%
  group_by(___) %>%
  summarize(___)

flights %>%
  count(___) %>%
  arrange(___)
Which carriers had the longest accumulated air time, excluding cancelled flights?
flights %>%
  group_by(___) %>%
  summarize(acc_air_time = sum(_____)) %>%
  ungroup()
Which carriers specialize on long-distance routes?
flights
  _____ %>%
  _____ %>%
  _____ %>%
  arrange(___)
Which plane had the most failed departure attempts? Can you find a solution without
filter()?Hint: Use the idiom
sum(___)to count the rows where a predicate is true.flights %>% filter(is.na(dep_time)) %>% group_by(tailnum) %>% _____ %>% _____ %>% filter(!is.na(tailnum)) %>% arrange(desc(___)) %>% head(1) flights %>% group_by(tailnum) %>% _____ %>% _____ %>% arrange(_____) %>% head(1)Compute the ratio of short-distance routes (less than 300 miles) for each airline.
Hint: Use the idiom
mean(___)to compute the share of rows where a predicate is true.flights %>% group_by(carrier) %>% _____ %>% ungroup()Find more exercises in item 1 of Section 5.6.7 of r4ds.
Summarize with multiple variables
Which relation is serviced by the largest number of distinct airlines? Find a solution using
summarize(), one usingcount(), and one usingtally(). Which is more elegant?flights %>% group_by(___, ___, airline) %>% summarize(n = n()) %>% summarize(n_airlines = ___) %>% ungroup() %>% arrange(___) %>% head(1) flights %>% count(_____) %>% count(_____) %>% _____ %>% _____ flights %>% group_by(_____) %>% tally() %>% tally(wt = NULL) %>% _____ %>% _____Compute the share of cancelled flights per month per airline.
flights %>%
  group_by(_____) %>%
  summarize(share_of_cancelled = _____) %>%
  ungroup()
Find more exercises in Section 5.6.7 of r4ds.
Putting it all together: Preparing a time series for plotting
flights %>%
  mutate(date = lubridate::make_date(year, month, day)) %>%
  group_by(origin, date) %>%
  summarize(
    dep_delay = median(dep_delay, na.rm = TRUE)
  ) %>%
  ungroup() %>%
  tsbox::ts_ggplot()
## [time]: 'date' [value]: 'dep_delay'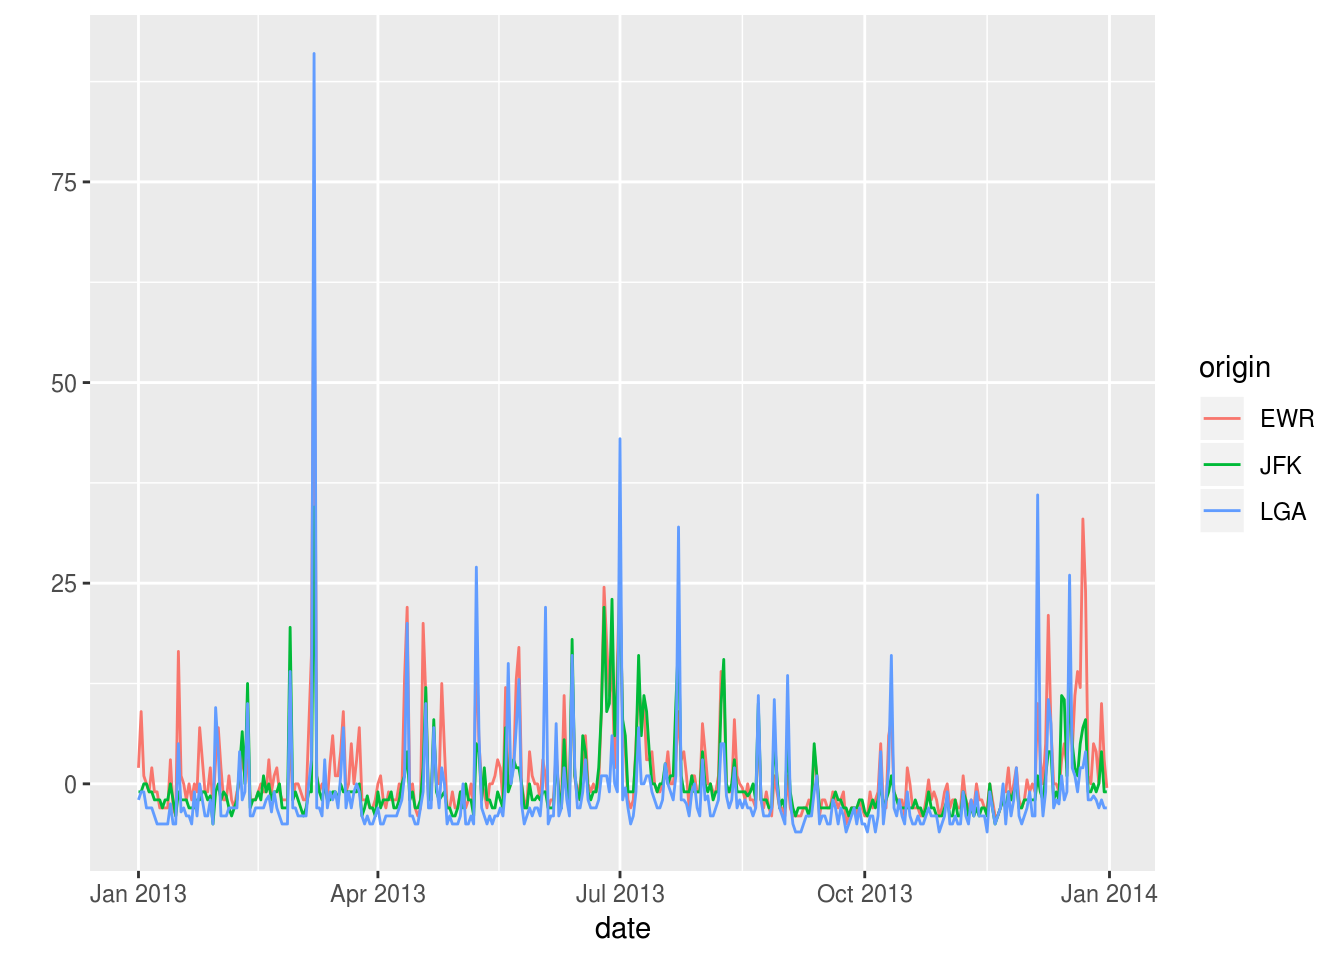
flights %>%
  mutate(date = lubridate::make_date(year, month, day)) %>%
  group_by(date) %>%
  summarize(
    dep_delay = median(dep_delay, na.rm = TRUE),
    arr_delay = median(arr_delay, na.rm = TRUE),
  ) %>%
  ungroup() %>%
  tsbox::ts_long() %>%
  tsbox::ts_ggplot()
## [time]: 'date'
## [time]: 'date'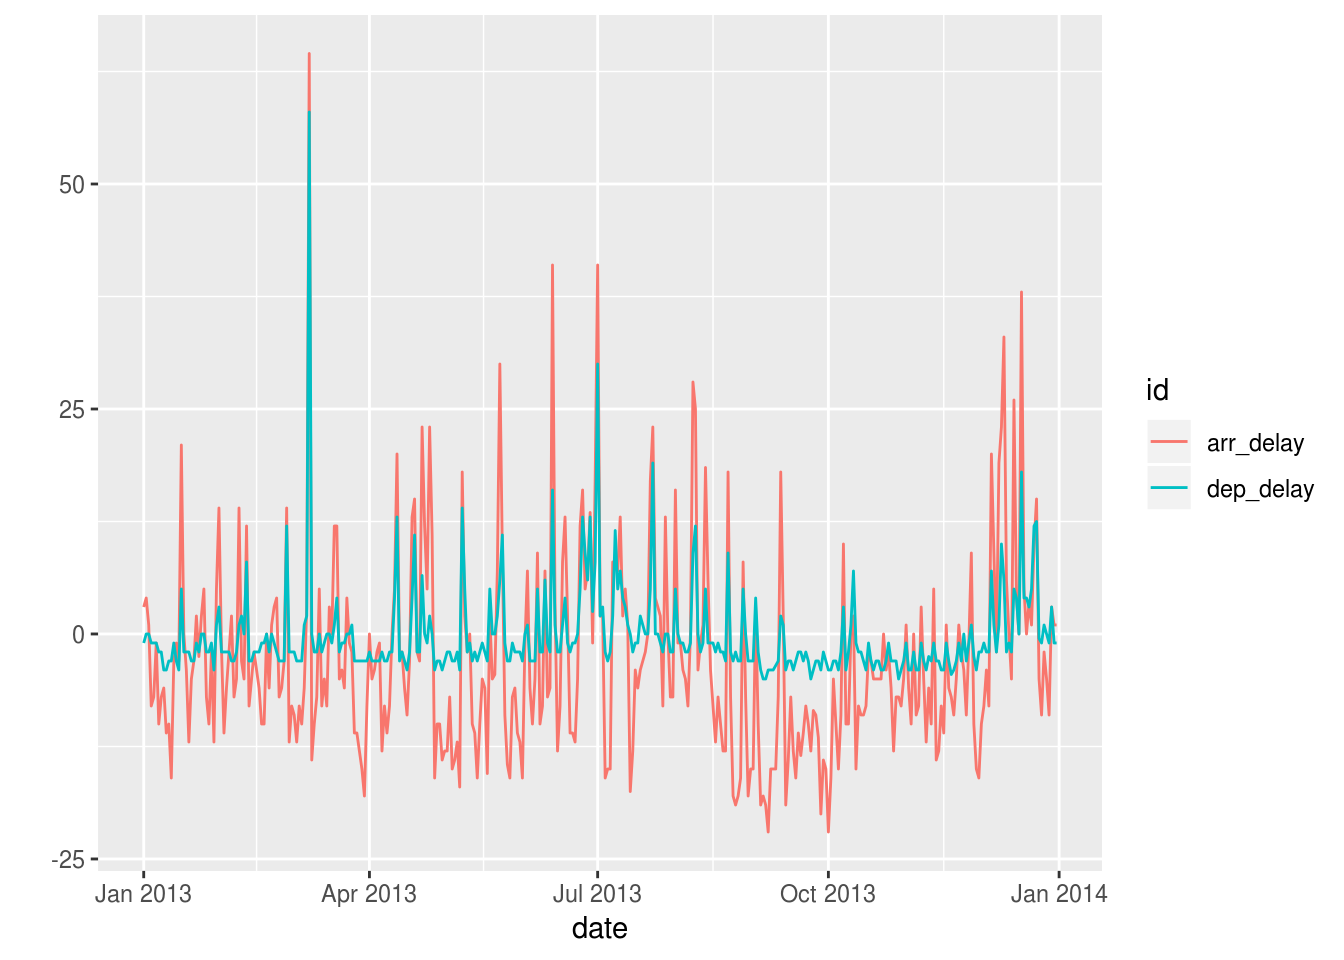
Copyright © 2018 Kirill Müller. Licensed under CC BY-NC 4.0.