Trend data
Kirill Müller
October 20, 2017
Assignment 1
library(gfdata)
all_stats %>%
  filter(five_regions == "High Impact Asia") %>%
  ggplot(aes(x = year, y = hiv_new_infections_number)) +
  geom_line() +
  facet_wrap(~country, scales = "free_y")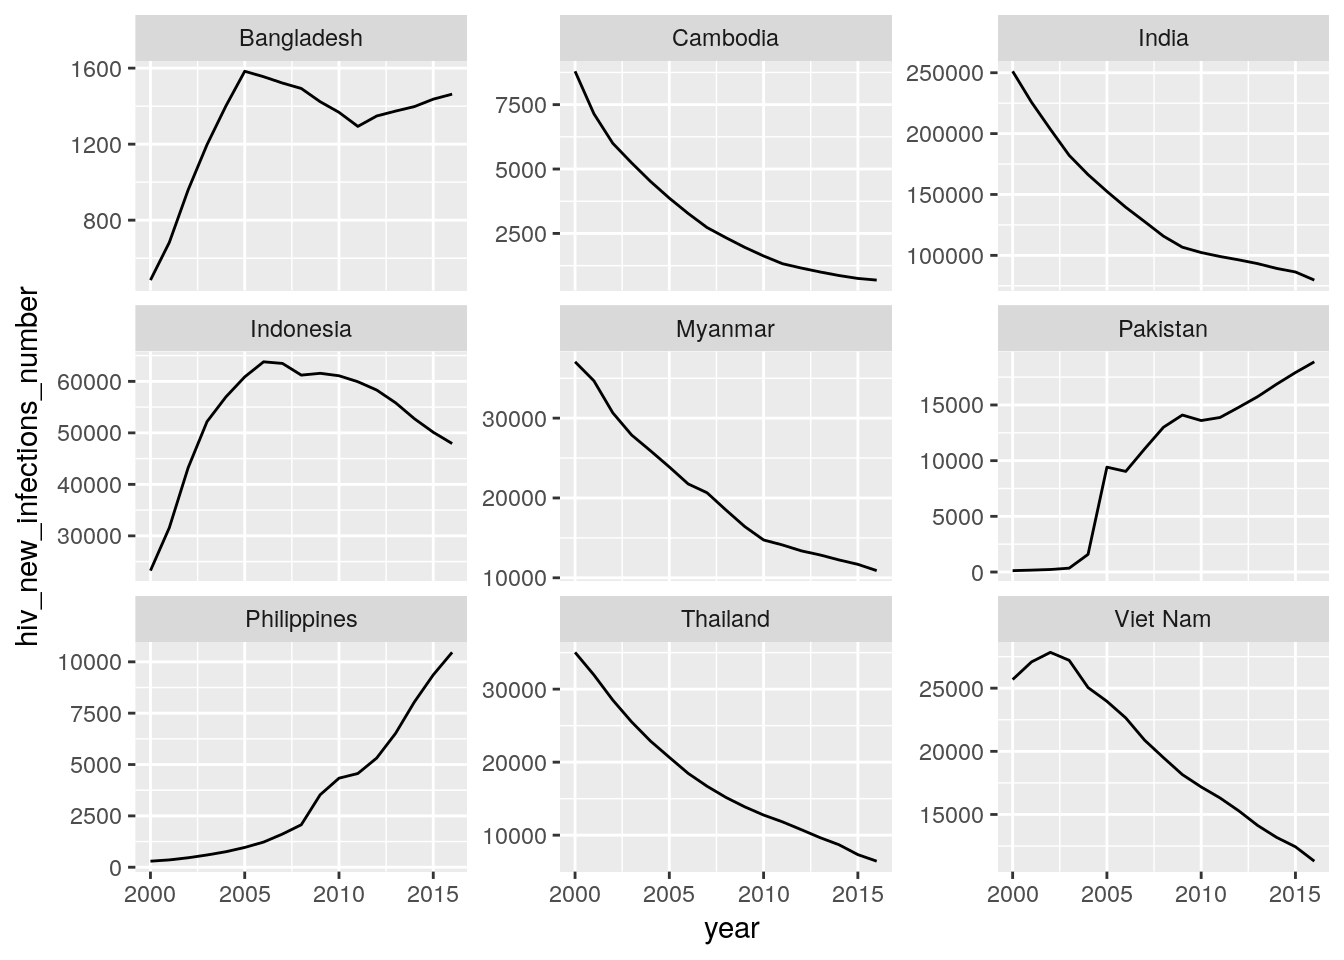
all_stats %>%
  filter(five_regions == "High Impact Asia") %>%
  ggplot(aes(x = year, y = tb_new_cases_number)) +
  geom_line() +
  facet_wrap(~country, scales = "free_y")
## Warning: Removed 1 rows containing missing values (geom_path).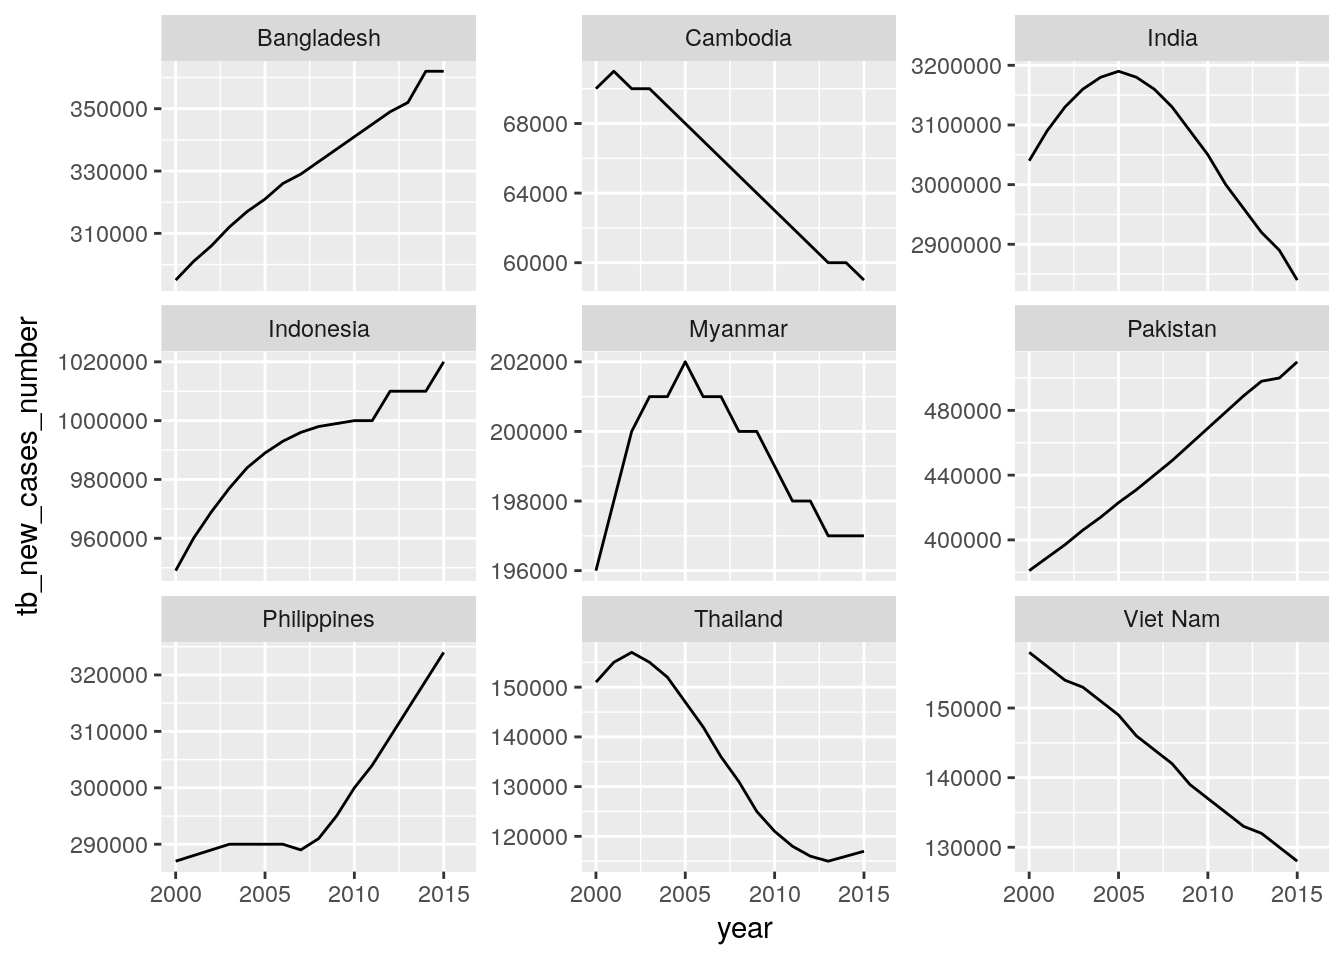
all_stats %>%
  filter(five_regions == "High Impact Asia") %>%
  ggplot(aes(x = year, y = malaria_new_cases_number)) +
  geom_line() +
  facet_wrap(~country, scales = "free_y")
## Warning: Removed 1 rows containing missing values (geom_path).
Assignment 2
library(gfdata)
all_stats_new_cases_long <-
  all_stats %>%
  rename(hiv_new_cases_number = hiv_new_infections_number) %>%
  select(
    five_regions, country, year,
    ends_with("_new_cases_number")
  ) %>%
  gather(indicator, count, -five_regions, -country, -year) %>%
  separate(
    indicator,
    into = c("disease", "indicator"),
    extra = "merge"
  ) %>%
  mutate(disease = recode(
    disease,
    "tb" = "TB", "malaria" = "Malaria", "hiv" = "HIV"
  )) %>%
  mutate(disease = forcats::fct_inorder(disease)) %>%
  spread(indicator, count)

all_stats_new_cases_long
## # A tibble: 6,477 x 5
## five_regions country year disease new_cases_number
## * <chr> <chr> <dbl> <fctr> <dbl>
## 1 Africa and Middle East Algeria 2000 HIV 595
## 2 Africa and Middle East Algeria 2000 TB 23000
## 3 Africa and Middle East Algeria 2000 Malaria 41.2
## 4 Africa and Middle East Algeria 2001 HIV 650
## 5 Africa and Middle East Algeria 2001 TB 23000
## 6 Africa and Middle East Algeria 2001 Malaria 9.41
## 7 Africa and Middle East Algeria 2002 HIV 705
## 8 Africa and Middle East Algeria 2002 TB 24000
## 9 Africa and Middle East Algeria 2002 Malaria 9.41
## 10 Africa and Middle East Algeria 2003 HIV 762
## # ... with 6,467 more rowsall_stats_new_cases_long %>%
filter(five_regions == "High Impact Asia") %>%
ggplot(aes(x = year, y = new_cases_number)) +
geom_line() +
facet_grid(country~disease, scales = "free")## Warning: Removed 1 rows containing missing values (geom_path).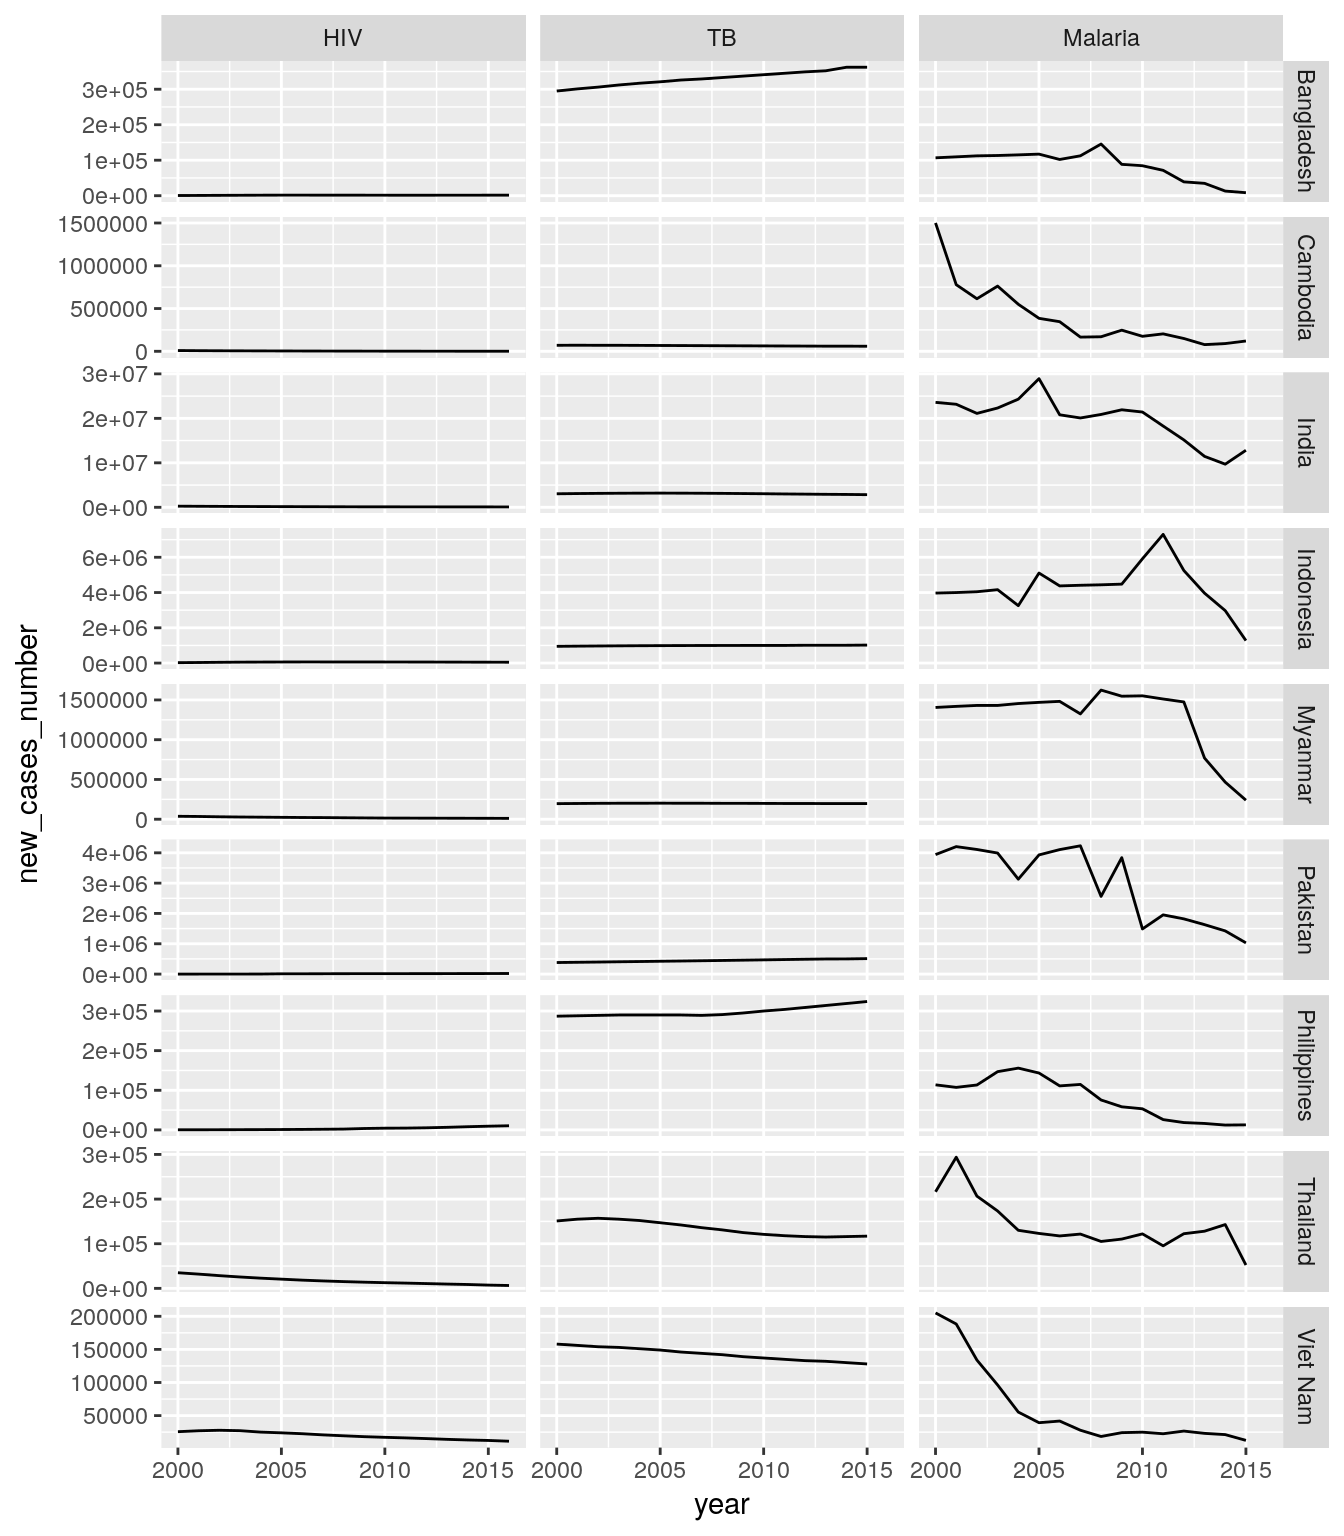
Assignment 3
library(gfdata)
all_stats_new_cases_long %>%
  group_by(five_regions, year, disease) %>%
  summarize(new_cases_number = sum(new_cases_number, na.rm = TRUE)) %>%
  ungroup() %>%
  ggplot(aes(x = year, y = new_cases_number)) +
  geom_line() +
  facet_grid(five_regions~disease, scales = "free")
Assignment 4
library(gfdata)
all_stats_inc_mort_long <-
  all_stats %>%
  rename(hiv_new_cases_number = hiv_new_infections_number) %>%
  rename(hiv_deaths_number = aids_deaths_number) %>%
  group_by(five_regions, country) %>%
  mutate(lag_population_excluding_plwha = lag(population_excluding_plwha) * 100) %>%
  ungroup() %>%
  transmute(
    five_regions, country, year,
    nominator_hiv_incidence = hiv_new_cases_number * 100,
    denominator_hiv_incidence = lag_population_excluding_plwha,
    nominator_hiv_mortality = hiv_deaths_number * 100,
    denominator_hiv_mortality = population_all_ages,
    nominator_tb_incidence = tb_new_cases_number * 100000,
    denominator_tb_incidence = population_all_ages,
    nominator_tb_mortality = tb_deaths_number * 100000,
    denominator_tb_mortality = population_all_ages,
    nominator_malaria_incidence = malaria_new_cases_number * 1000,
    denominator_malaria_incidence = population_at_malaria_risk,
    nominator_malaria_mortality = malaria_deaths_number * 1000,
    denominator_malaria_mortality = population_at_malaria_risk
  ) %>%
  gather(indicator, value, -five_regions, -country, -year) %>%
  separate(
    indicator,
    into = c("nom_denom", "indicator"),
    extra = "merge"
  ) %>%
  mutate(nom_denom = forcats::fct_inorder(nom_denom)) %>%
  separate(
    indicator,
    into = c("disease", "indicator"),
    extra = "merge"
  ) %>%
  mutate(disease = recode(
    disease,
    "tb" = "TB", "malaria" = "Malaria", "hiv" = "HIV"
  )) %>%
  mutate(disease = forcats::fct_inorder(disease)) %>%
  spread(nom_denom, value) %>%
  filter(nominator > 0 & denominator > 0)

all_stats_inc_mort_long
## # A tibble: 10,162 x 7
## five_regions country year disease indicator nominat… denomi…
## <chr> <chr> <dbl> <fctr> <chr> <dbl> <dbl>
## 1 Africa and Middle East Algeria 2000 HIV mortality 1.85e⁴ 3.12e⁷
## 2 Africa and Middle East Algeria 2000 TB incidence 2.30e⁹ 3.12e⁷
## 3 Africa and Middle East Algeria 2000 TB mortality 2.50e⁸ 3.12e⁷
## 4 Africa and Middle East Algeria 2000 Malaria incidence 4.12e⁴ 1.09e⁶
## 5 Africa and Middle East Algeria 2000 Malaria mortality 2.07e³ 1.09e⁶
## 6 Africa and Middle East Algeria 2001 HIV incidence 6.50e⁴ 3.12e⁹
## 7 Africa and Middle East Algeria 2001 HIV mortality 2.06e⁴ 3.16e⁷
## 8 Africa and Middle East Algeria 2001 TB incidence 2.30e⁹ 3.16e⁷
## 9 Africa and Middle East Algeria 2001 TB mortality 2.50e⁸ 3.16e⁷
## 10 Africa and Middle East Algeria 2001 Malaria incidence 9.41e³ 1.11e⁶
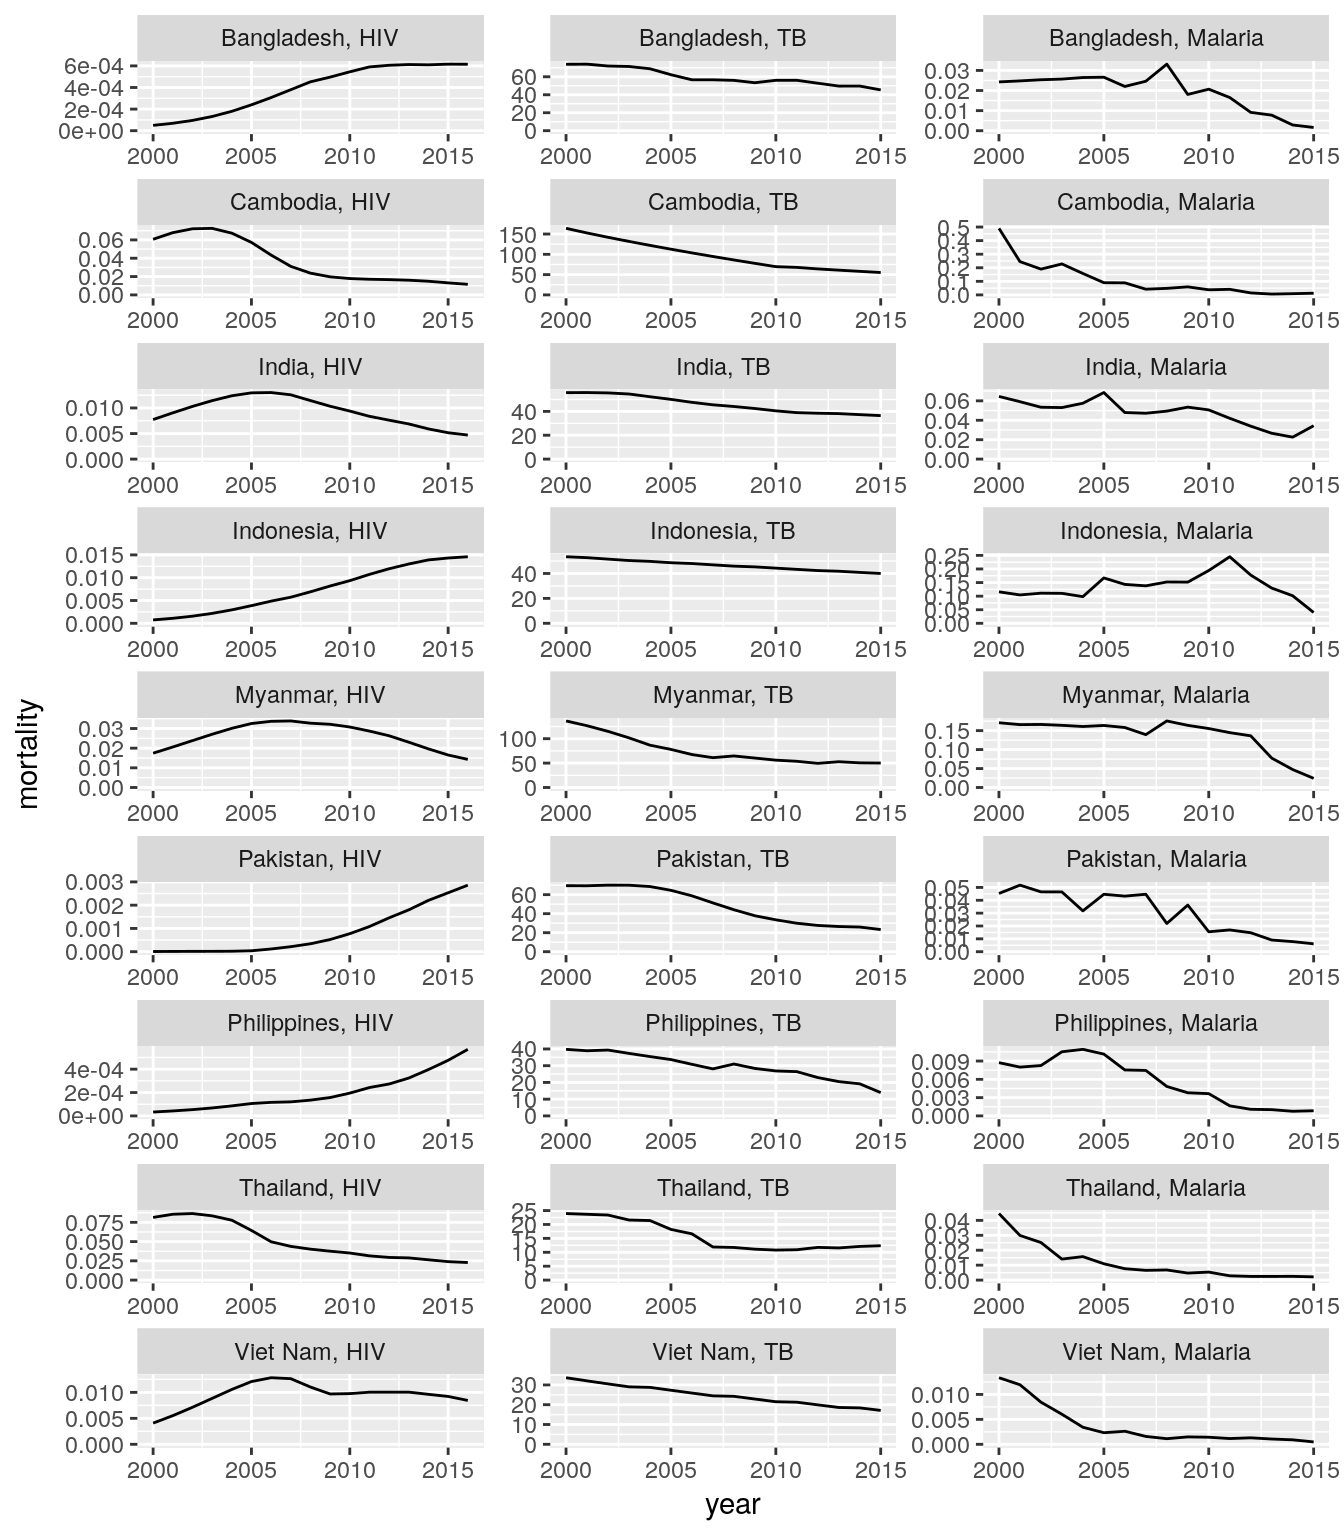
## # ... with 10,152 more rowsall_stats_inc_mort_long %>%
filter(five_regions == "High Impact Asia") %>%
filter(indicator == "mortality") %>%
transmute(
country, year, disease, indicator,
rate = nominator / denominator
) %>%
spread(indicator, rate) %>%
ggplot(aes(x = year, y = mortality)) +
geom_line() +
scale_y_continuous(limits = c(0, NA)) +
facet_wrap(
~country + disease,
scales = "free",
ncol = 3,
labeller = labeller(.multi_line = FALSE)
)
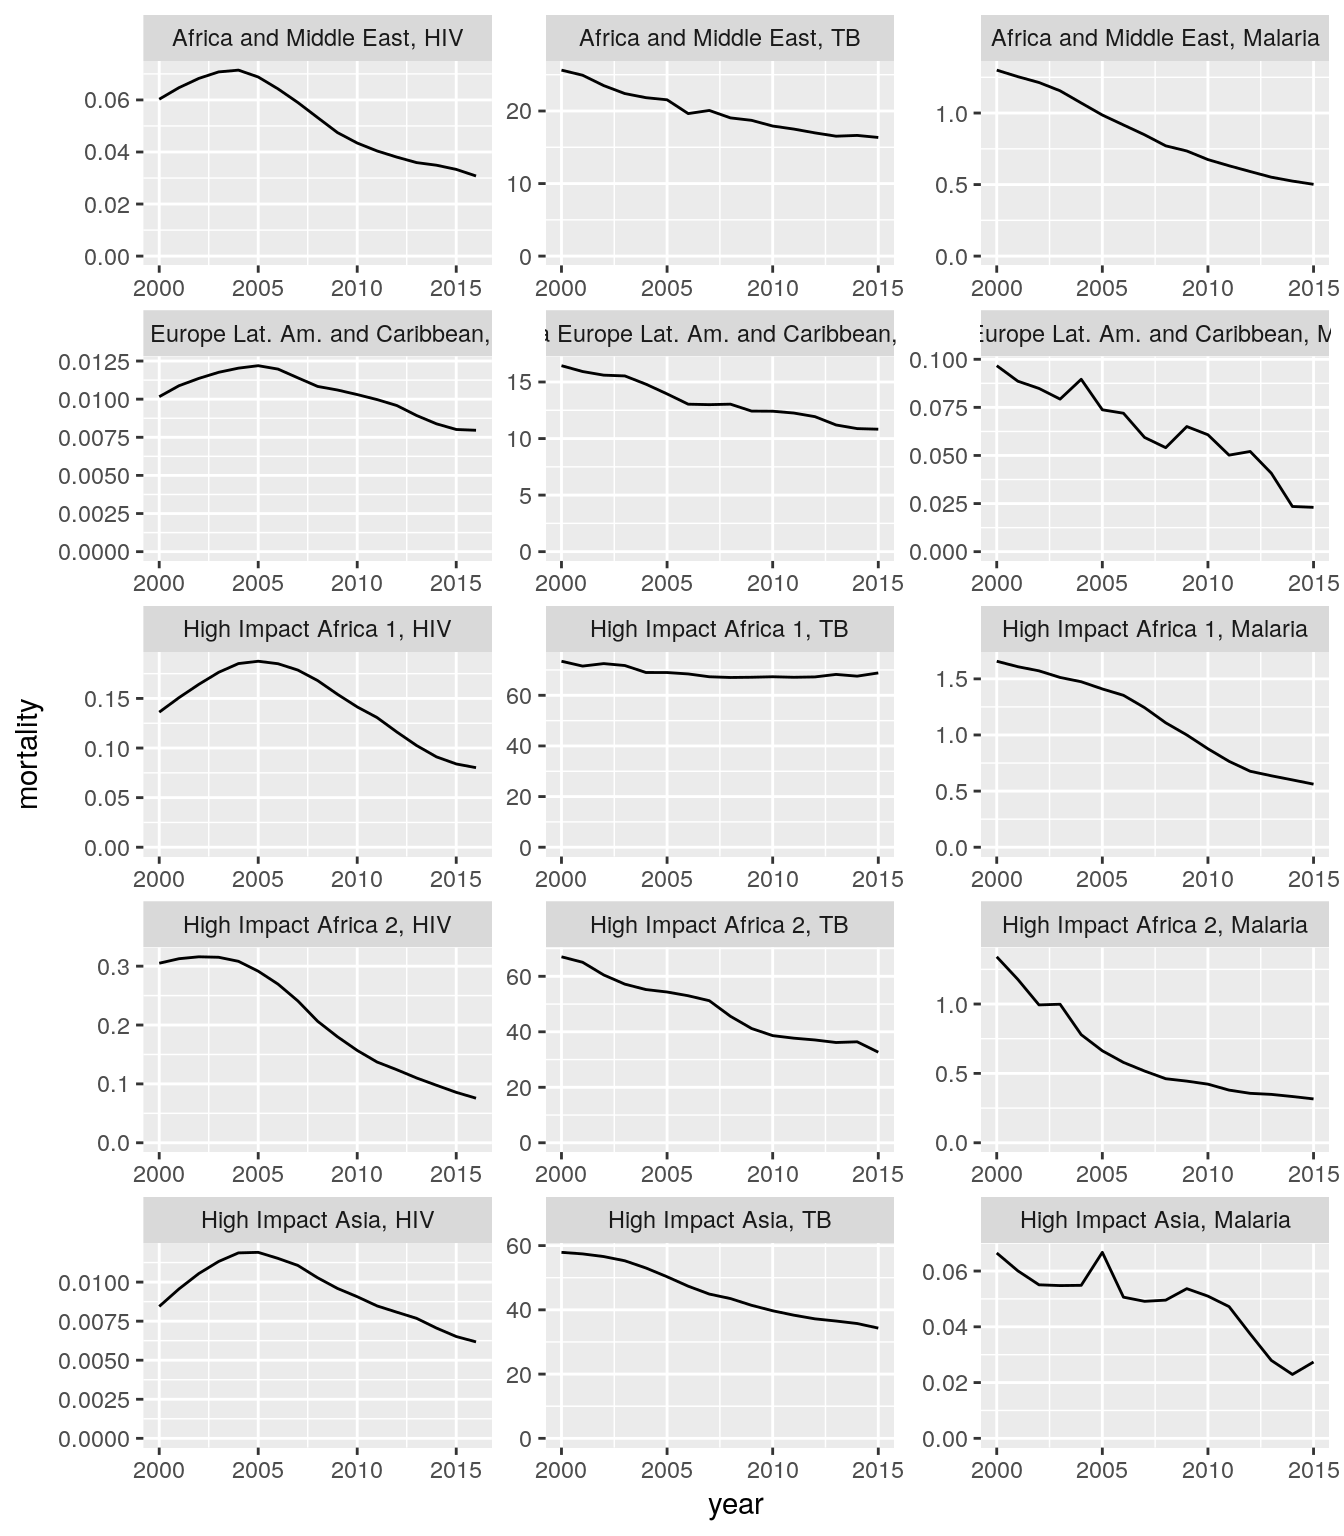
Assignment 5
all_stats_inc_mort_long %>%
  group_by(five_regions, disease, indicator, year) %>%
  summarise(
    rate = sum(nominator) / sum(denominator)
  ) %>%
  spread(indicator, rate) %>%
  ggplot(aes(x = year, y = mortality)) +
  geom_line() +
  scale_y_continuous(limits = c(0, NA)) +
  facet_wrap(
    ~five_regions + disease,
    scales = "free",
    ncol = 3,
    labeller = labeller(.multi_line = FALSE)
  )
Assignment 6
all_stats_inc_mort_long %>%
  group_by(five_regions, disease, indicator, year) %>%
  summarise(
    rate = sum(nominator) / sum(denominator)
  ) %>%
  mutate(rate_change = rate / first(rate)) %>%
  select(-rate) %>%
  ungroup() %>%
  spread(indicator, rate_change) %>%
  ggplot(aes(x = year, y = mortality)) +
  geom_line() +
  facet_grid(five_regions ~ disease)
Assignment 7
all_stats %>%
  select(
    five_regions, country, year,
    people_living_with_hiv_aids_number,
    people_living_with_hiv_aids_lower_number,
    people_living_with_hiv_aids_higher_number
  ) %>%
  filter(grepl("^High Impact ", five_regions)) %>%
  ggplot(aes(x = year)) +
  geom_ribbon(
    aes(
      ymin = people_living_with_hiv_aids_lower_number,
      ymax = people_living_with_hiv_aids_higher_number
    ),
    fill = "grey"
  ) +
  geom_line(
    aes(
      y = people_living_with_hiv_aids_number
    ),
    color = "green"
  ) +
  scale_y_continuous(limits = c(0, NA)) +
  facet_wrap(~country, scales = "free_y")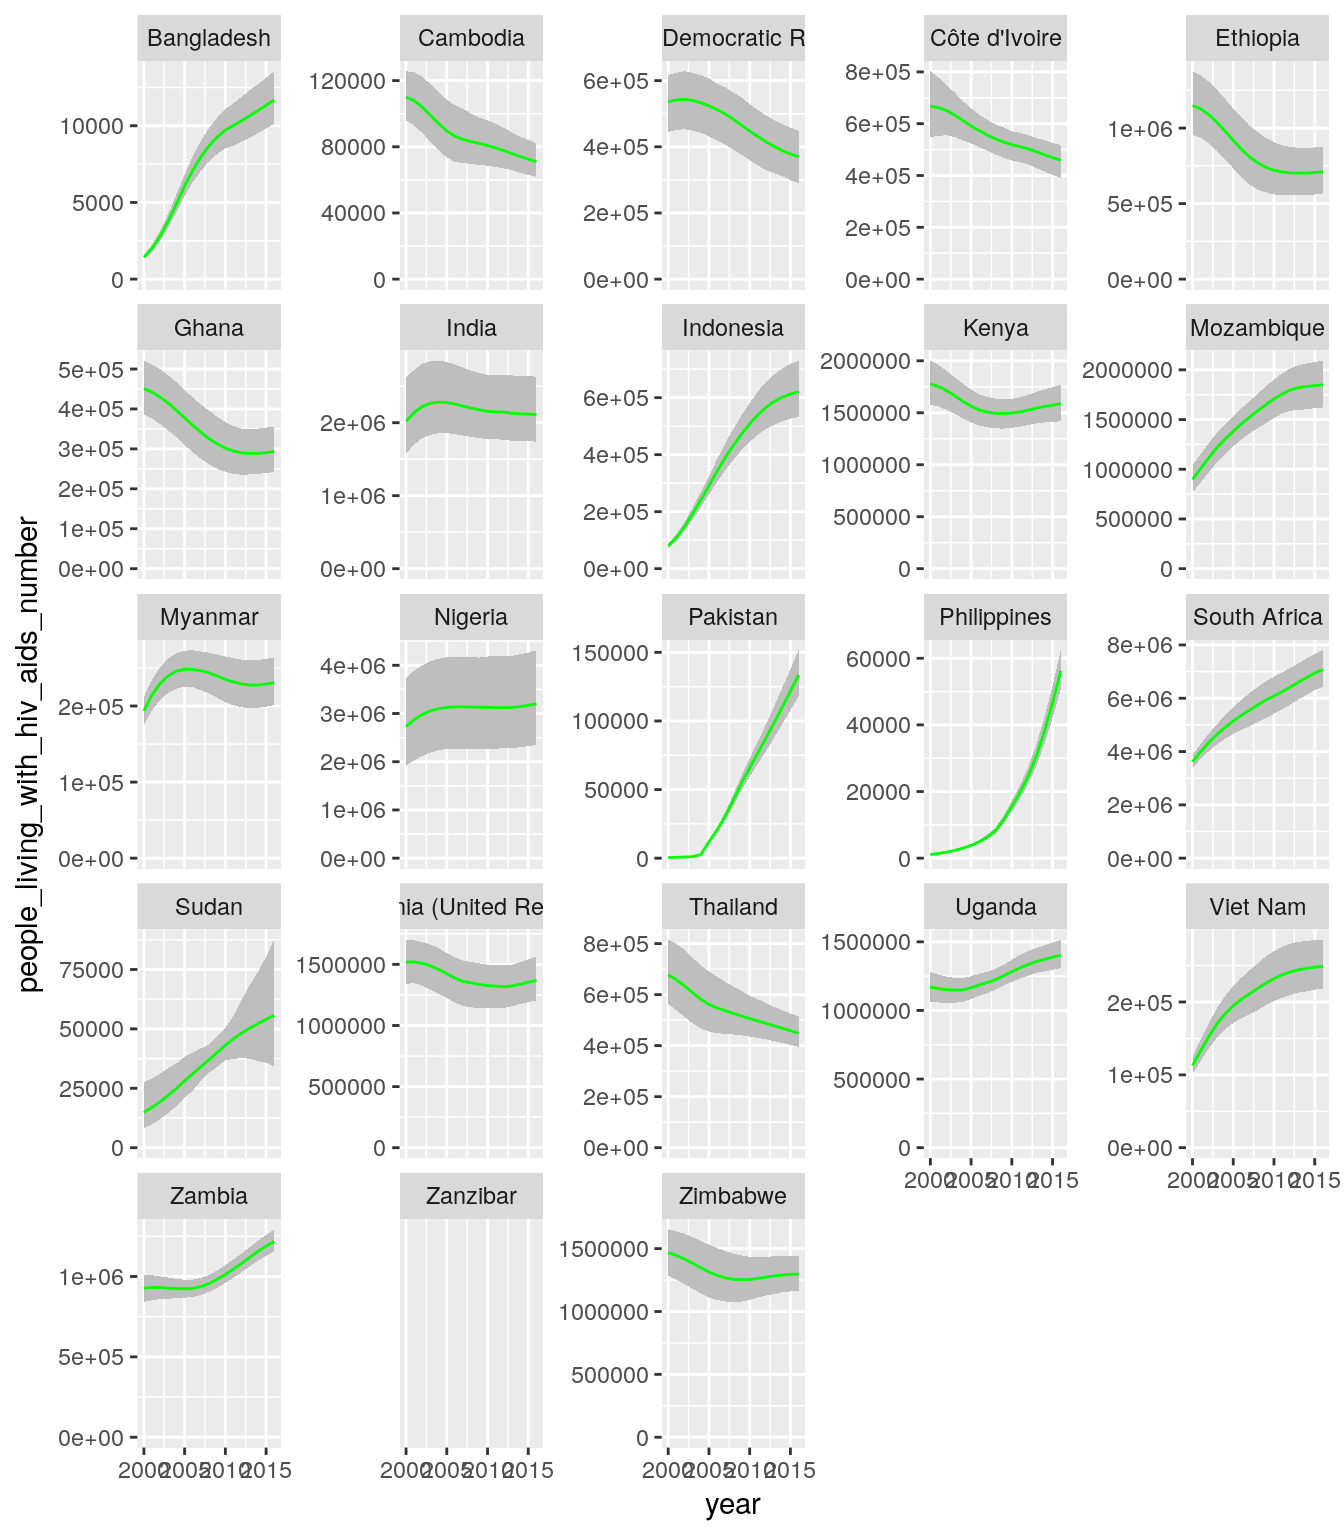
Assignment 8
all_stats %>%
  select(
    five_regions, country, year,
    people_living_with_hiv_aids_number,
    people_living_with_hiv_aids_lower_number,
    people_living_with_hiv_aids_higher_number
  ) %>%
  group_by(five_regions, year) %>%
  summarize_at(
    vars(starts_with("people_living_with_hiv_aids_")),
    funs(sum(., na.rm = TRUE))
  ) %>%
  ungroup() %>%
  ggplot(aes(x = year)) +
  geom_ribbon(
    aes(
      ymin = people_living_with_hiv_aids_lower_number,
      ymax = people_living_with_hiv_aids_higher_number
    ),
    fill = "grey"
  ) +
  geom_line(
    aes(
      y = people_living_with_hiv_aids_number
    ),
    color = "green"
  ) +
  scale_y_continuous(limits = c(0, NA)) +
  facet_wrap(~five_regions, scales = "free_y")
Assignment 9
library(gfdata)
eligibility <-
  all_stats %>%
  select(
    five_regions, country, year,
    ends_with("_eligible")
  ) %>%
  gather(disease, eligible, -five_regions, -country, -year) %>%
  separate(disease, into = c("disease"), extra = "drop")

deaths <-
  all_stats %>%
  select(
    five_regions, country, year,
    hiv_deaths_number = aids_deaths_number,
    ends_with("_deaths_number")
  ) %>%
  gather(disease, deaths_number, -five_regions, -country, -year) %>%
  separate(disease, into = c("disease"), extra = "drop")

eligibility %>%
  left_join(deaths, by = c("five_regions", "country", "year", "disease")) %>%
  group_by(year, disease, eligible) %>%
  summarize(deaths_number = sum(deaths_number, na.rm = TRUE)) %>%
  mutate(deaths_share = deaths_number / sum(deaths_number, na.rm = TRUE)) %>%
  select(-deaths_number) %>%
  ungroup() %>%
  filter(eligible != "Yes") %>%
  filter(year <= 2015) %>%
  ggplot(aes(disease, deaths_share, fill = eligible)) +
  geom_col() +
  scale_y_continuous(labels = scales::percent) +
  facet_wrap(~year)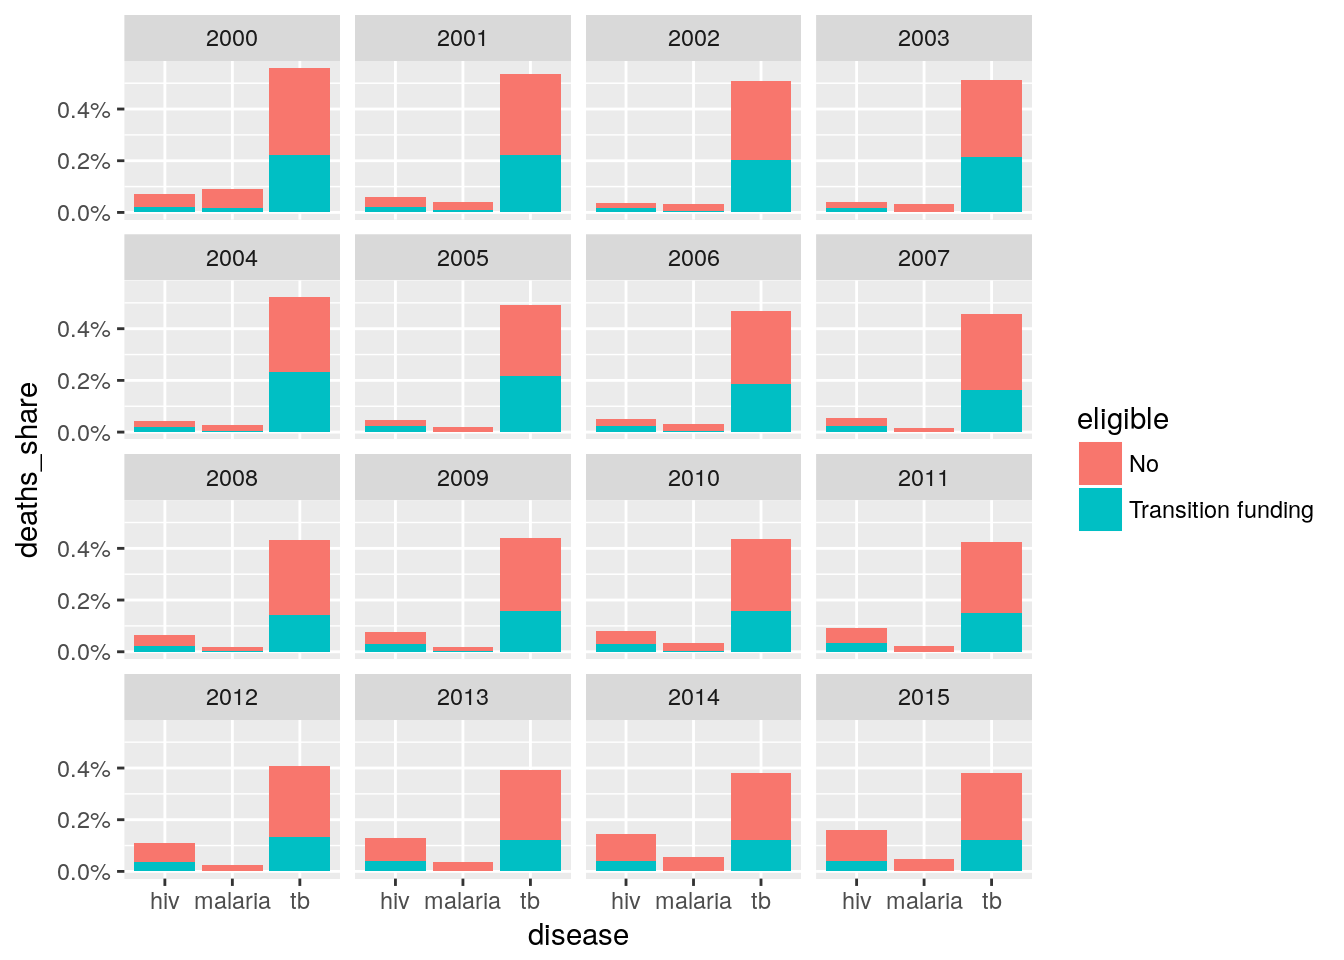
Copyright © 2017 Kirill Müller. Licensed under CC BY-NC 4.0.