Summarize by multiple variables
Kirill Müller
October 19, 2017
Distinct airlines per destination
flights %>%
  group_by(origin, dest, carrier) %>%
  summarize(n_flights = n()) %>%
  summarize(n_distinct_carriers = n()) %>%
  ungroup() %>%
  arrange(desc(n_distinct_carriers))
## # A tibble: 224 x 3
## origin dest n_distinct_carriers
## <chr> <chr> <int>
## 1 EWR DTW 5
## 2 EWR MSP 5
## 3 JFK LAX 5
## 4 JFK SFO 5
## 5 JFK TPA 5
## 6 LGA ATL 5
## 7 LGA CLE 5
## 8 LGA CLT 5
## 9 EWR ATL 4
## 10 JFK AUS 4
## # ... with 214 more rowsMuch shorter:
flights %>%
  count(origin, dest, carrier) %>%
  count(origin, dest) %>%
  ungroup() %>%
  arrange(desc(nn))
## # A tibble: 224 x 3
## origin dest nn
## <chr> <chr> <int>
## 1 EWR DTW 5
## 2 EWR MSP 5
## 3 JFK LAX 5
## 4 JFK SFO 5
## 5 JFK TPA 5
## 6 LGA ATL 5
## 7 LGA CLE 5
## 8 LGA CLT 5
## 9 EWR ATL 4
## 10 JFK AUS 4
## # ... with 214 more rowsCancelled flights per month per airline
flights %>%
  group_by(carrier, month) %>%
  summarize(share_of_cancelled = mean(is.na(dep_time))) %>%
  ungroup() %>%
  ggplot() +
  geom_raster(aes(x = carrier, y = factor(month), fill = share_of_cancelled))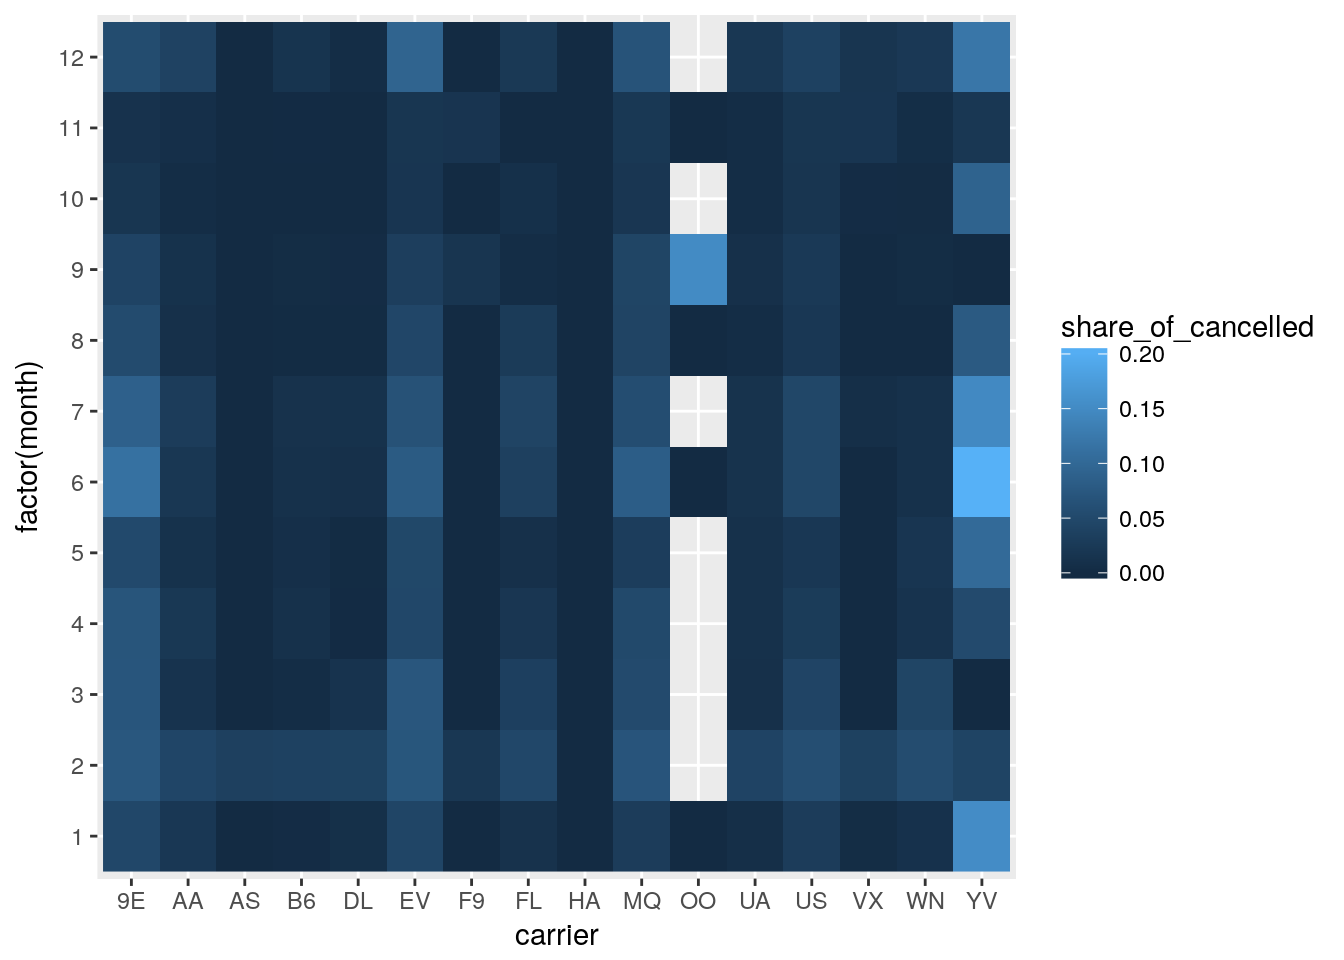
Copyright © 2017 Kirill Müller. Licensed under CC BY-NC 4.0.