R + markdown
Kirill Müller
October 18, 2017
---
title: "Test document"
author: "Kirill Müller"
date: "October 17, 2017"
output: html_document
---

```{r setup, include=FALSE}
knitr::opts_chunk$set(echo = FALSE)
library(tidyverse)
```

# Introduction

We will be reviewing a dataset of `r nrow(mpg)` cars. The dataset is listed below.

```{r}
mpg
```

## Relationship between engine displacement and highway mileage

The plot below should *not* surprise us: The larger the engine, the more energy it consumes per distance driven (in $\frac{\text{J}}{\text{km}}$), the less is the mileage per unit of gasoline (in $\frac{\text{miles}}{\text{gallon}}$).

```{r}
ggplot(mpg, aes(displ, hwy)) +
  geom_point()
```

Possible reasons why people would choose a larger engine include:

- ...
- ...
- ...
Introduction
We will be reviewing a dataset of 234 cars. The dataset is listed below.
mpg## # A tibble: 234 x 11
## manufac… model displ year cyl trans drv cty hwy fl class
## <chr> <chr> <dbl> <int> <int> <chr> <chr> <int> <int> <chr> <chr>
## 1 audi a4 1.80 1999 4 auto(… f 18 29 p comp…
## 2 audi a4 1.80 1999 4 manua… f 21 29 p comp…
## 3 audi a4 2.00 2008 4 manua… f 20 31 p comp…
## 4 audi a4 2.00 2008 4 auto(… f 21 30 p comp…
## 5 audi a4 2.80 1999 6 auto(… f 16 26 p comp…
## 6 audi a4 2.80 1999 6 manua… f 18 26 p comp…
## 7 audi a4 3.10 2008 6 auto(… f 18 27 p comp…
## 8 audi a4 qua… 1.80 1999 4 manua… 4 18 26 p comp…
## 9 audi a4 qua… 1.80 1999 4 auto(… 4 16 25 p comp…
## 10 audi a4 qua… 2.00 2008 4 manua… 4 20 28 p comp…
## # ... with 224 more rowsRelationship between engine displacement and highway mileage
The plot below should not surprise us: The larger the engine, the more energy it consumes per distance driven (in \(\frac{\text{J}}{\text{km}}\)), the less is the mileage per unit of gasoline (in \(\frac{\text{miles}}{\text{gallon}}\)).
ggplot(mpg, aes(displ, hwy)) +
  geom_point()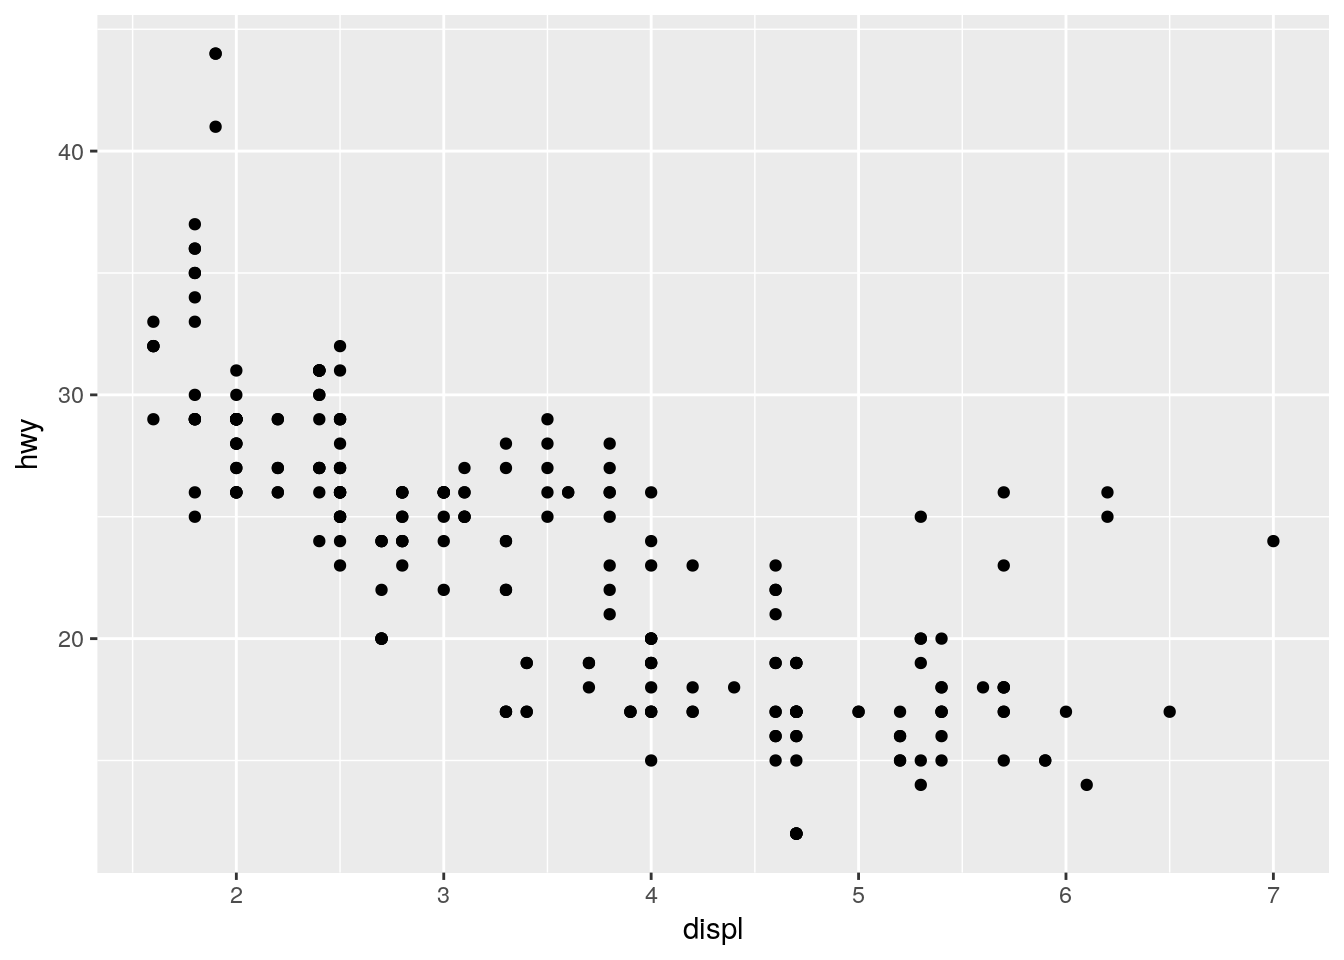
Possible reasons why people would choose a larger engine include:
- …
- …
- …
Copyright © 2017 Kirill Müller. Licensed under CC BY-NC 4.0.